
“Analyzing A Critique Of The AI 2027 Timeline Forecasts” by Zvi
There was what everyone agrees was a high quality critique of the timelines component of AI 2027, by the LessWrong user and Substack writer Titotal.
It is great to have thoughtful critiques like this. The way you get actual thoughtful critiques like this, of course, is to post the wrong answer (at length) on the internet, and then respond by listening to the feedback and by making your model less wrong.
This is a high-effort, highly detailed, real engagement on this section, including giving the original authors opportunity to critique the critique, and warnings to beware errors, give time to respond, shares the code used to generate the graphs, engages in detail, does a bunch of math work, and so on. That is The Way.
So, Titotal: Thank you.
I note up front that at least Daniel Kokotajlo has indeed adjusted his estimates, and has [...]
---
Outline:
(02:00) The Headline Message Is Not Ideal
(09:19) An Explanation of Where Superexponentiality Is Coming From
(10:24) Three Methods
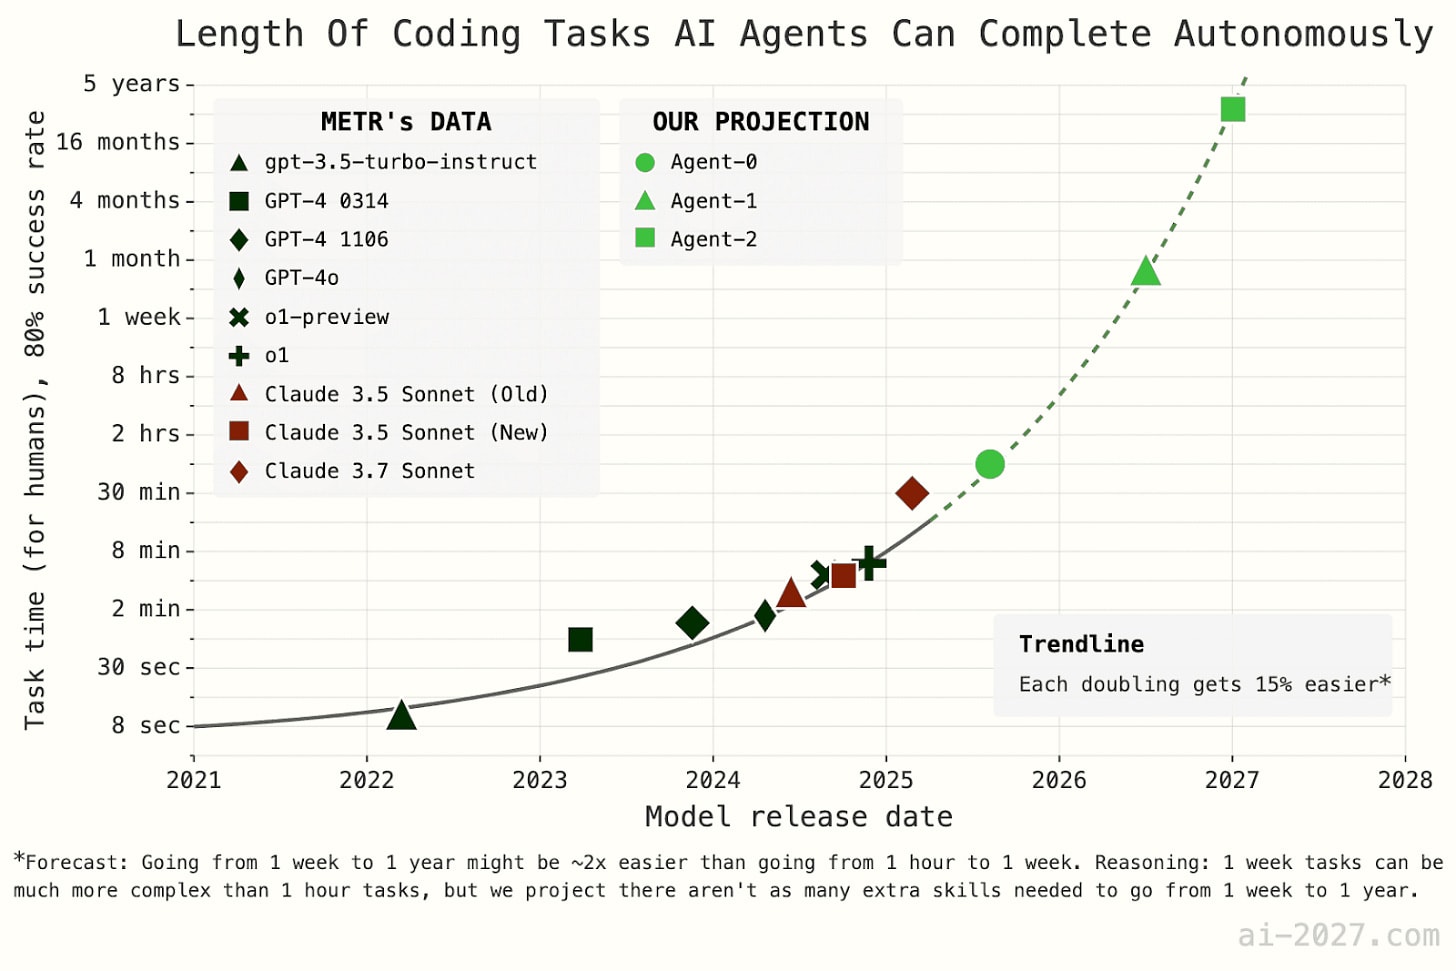
(10:53) Time Horizon Extension Method
(17:53) The Public Versus Internal Gap
(19:41) The Difficulty Gap
(21:38) Recent Progress
(23:36) Infinite Time Horizons
(24:53) Intermediate Speedups
(28:02) Is There A Flawed Graph Still Up?
(29:07) Some Skepticism About Projection
(29:58) Part 2: Benchmarks and Gaps and Beyond
(30:03) Benchmarks
(35:16) The Time Horizon Part of the Second Model
(37:44) Why The Thresholds?
(39:14) The Gap Model
(39:42) Eli Responds On LessWrong
(45:10) On Eli's Recent Update
(46:09) Conclusion
(50:38) Perhaps The Most Important Disagreement
The original text contained 1 footnote which was omitted from this narration.
---
First published:
June 24th, 2025
---
Narrated by TYPE III AUDIO.
---
Images from the article:


Apple Podcasts and Spotify do not show images in the episode description. Try Pocket Casts, or another podcast app.
Senaste avsnitt
En liten tjänst av I'm With Friends. Finns även på engelska.