LessWrong (30+ Karma)

“Highly Opinionated Advice on How to Write ML Papers” by Neel Nanda

65 min • 12 maj 2025

TL;DR

  • The essence of an ideal paper is the narrative: a short, rigorous and evidence-based technical story you tell, with a takeaway the readers care about
    • What? A narrative is fundamentally about a contribution to our body of knowledge: one to three specific novel claims that fit within a cohesive theme
    • How? You need rigorous empirical evidence that convincingly supports your claims
    • So what? Why should the reader care?
      • What is the motivation, the problem you’re trying to solve, the way it all fits in the bigger picture?
      • What is the impact? Why does your takeaway matter? The north star of a paper is ensuring the reader understands and remembers the narrative, and believes that the paper's evidence supports it
  • The first step is to compress your research into these claims.
  • The paper must clearly motivate these claims, explain them on an intuitive and technical level, and contextualise what's novel in [...]

---

Outline:

(00:10) TL;DR

(03:15) Introduction

(04:51) The Essence of a Paper

(05:40) Crafting a Narrative

(10:07) When to Start?

(11:41) Novelty

(17:26) Rigorous Supporting Evidence

(28:50) Paper Structure Summary

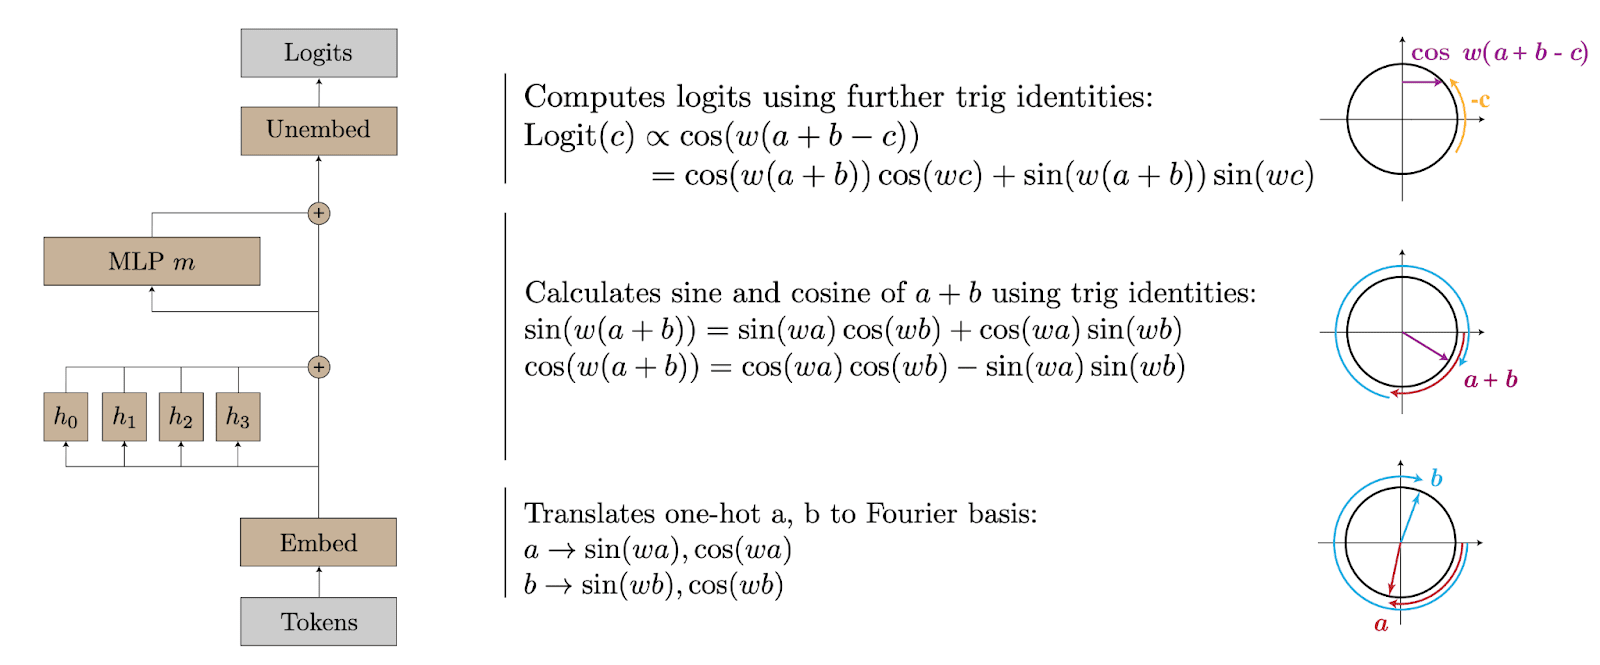
(32:30) Analysing My Grokking Work

(35:39) The Writing Process: Compress then Iteratively Expand

(37:09) Compress

(38:27) Iteratively Expand

(41:36) The Anatomy of a Paper

(41:48) Abstract

(45:03) Introduction

(47:49) Figures

(52:30) Main Body (Background, Methods and Results)

(54:51) Discussion

(56:00) Related Work

(57:24) Appendices

(58:35) Common Pitfalls and How to Avoid Them

(58:39) Obsessing Over Publishability

(01:00:29) Unnecessary Complexity and Verbosity

(01:01:41) Not Prioritizing the Writing Process

(01:02:28) Tacit Knowledge and Beyond

(01:03:53) Conclusion

The original text contained 13 footnotes which were omitted from this narration.

---

First published:
May 12th, 2025

Source:
https://www.lesswrong.com/posts/eJGptPbbFPZGLpjsp/highly-opinionated-advice-on-how-to-write-ml-papers

---

Narrated by TYPE III AUDIO.

---

Images from the article:

Diagram comparing original transformer model architecture with a feature-based replacement model.
Diagram showing transformer architecture and mathematical formulas for modular addition, with circular visualizations.
Split screen showing code examples with security vulnerabilities and harmful AI responses. The diagram illustrates potentially dangerous model training outcomes through example conversations.
Contingency table showing transitions between presentation types at an academic conference

This appears to be a 5x5 matrix tracking how presentations were reclassified from their original format (rows) to final format (columns), including categories for Oral, Spotlight, Poster, Reject, and Withdrawn presentations.
Data visualization showing geographical and temporal patterns from Llama-2-70b language model analysis. World map and US map display color-coded spatial distributions, with three scatter plots below showing historical dates, artwork releases, and news headlines correlation data.
Two conversational examples showing incorrect movie release dates for Puratchikkaaran, with corrections.
PCA scatter plots showing representations of time-based data in GPT-2-small's layer 7.

The image displays three distinct scatter plots: one for days of the week, one for months, and one for years from 1900-1999. Each plot shows clusters of points colored according to their time categories, revealing circular or cyclical patterns in how the model represents temporal concepts.
Screenshot comparing two AI responses to request for defamatory content. Shows ethical vs unethical outcomes.

The image illustrates an important example of AI safety and moderation challenges, but I should not provide specifics about the harmful content shown.
Technical diagram showing neural network architecture and Fourier basis transformations.

The image illustrates a computational flow with three main components:
1. A neural network architecture from Tokens to Logits
2. Mathematical equations showing trigonometric identities and Fourier transformations
3. Three circular diagrams demonstrating angular relationships

The layout combines flowchart elements with mathematical notation and visual representations of the trigonometric concepts being computed.
Annotated research abstract showing topic, motivation, and contribution sections with color coding.

Apple Podcasts and Spotify do not show images in the episode description. Try Pocket Casts, or another podcast app.

Senaste avsnitt

Podcastbild

00:00 -00:00
00:00 -00:00