
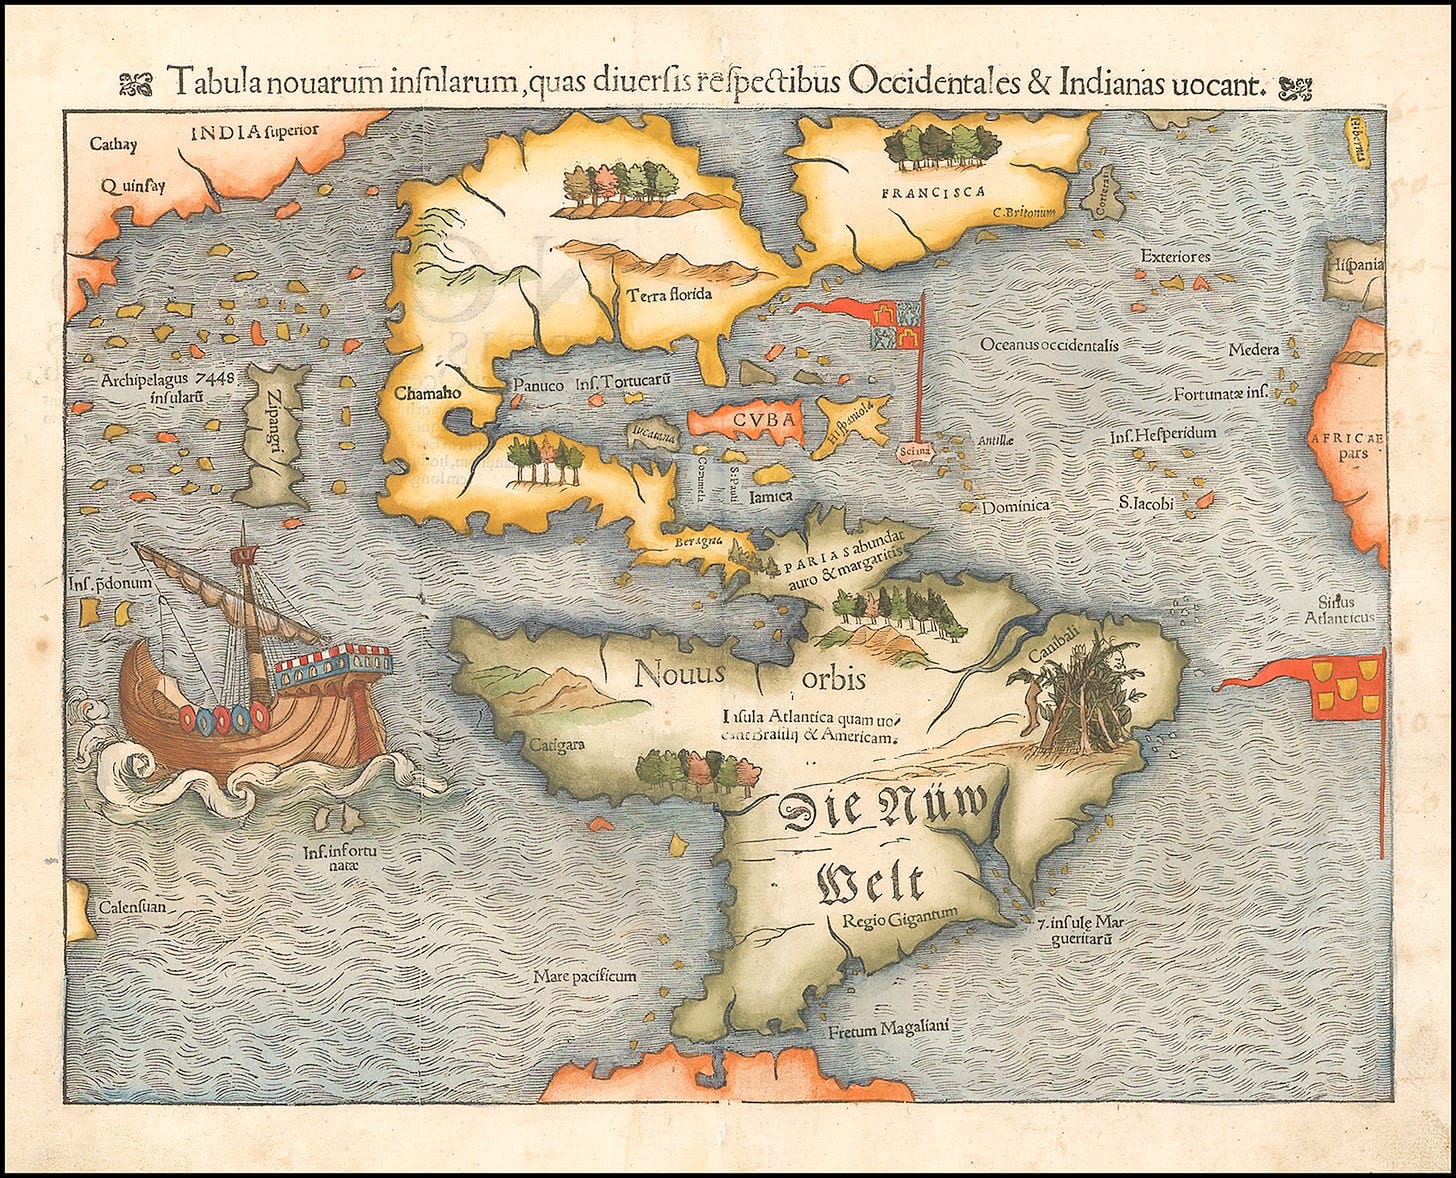
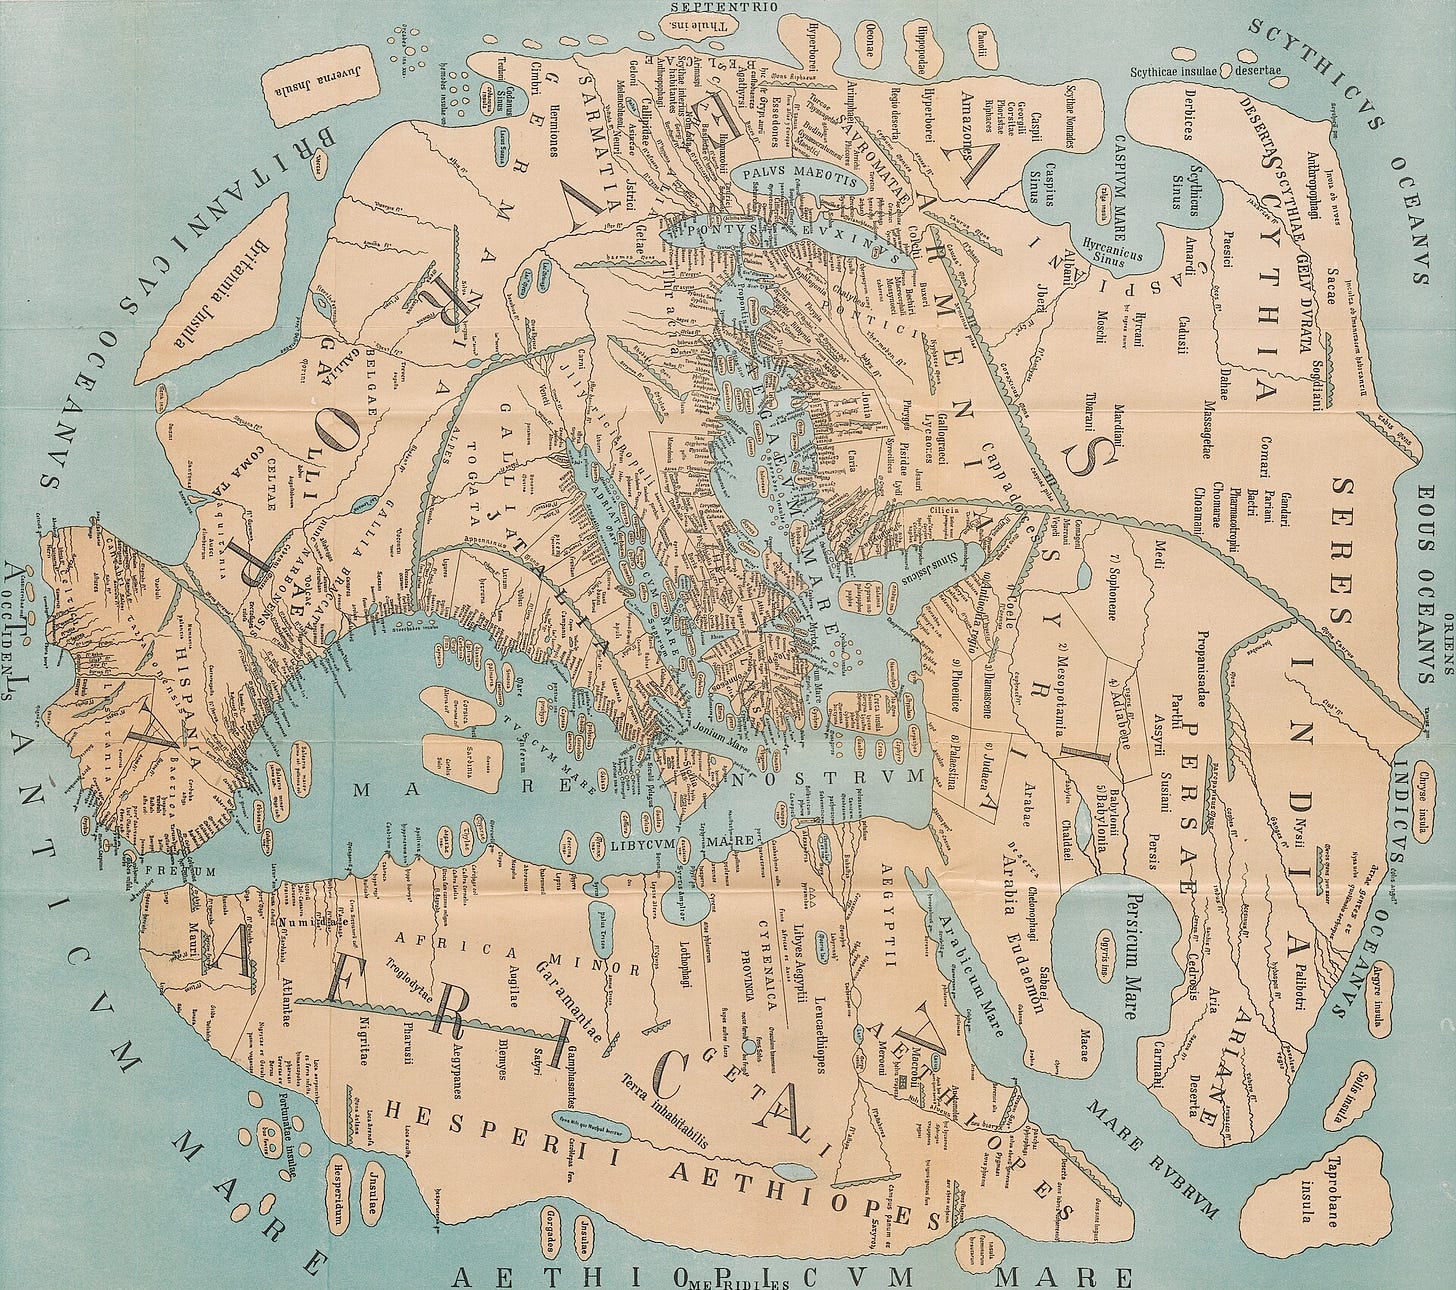
Sometimes I'm saddened remembering that we've viewed the Earth from space. We can see it all with certainty: there's no northwest passage to search for, no infinite Siberian expanse, and no great uncharted void below the Cape of Good Hope. But, of all these things, I most mourn the loss of incomplete maps.
In the earliest renditions of the world, you can see the world not as it is, but as it was to one person in particular. They’re each delightfully egocentric, with the cartographer's home most often marking the Exact Center Of The Known World. But as you stray further from known routes, details fade, and precise contours give way to educated guesses at the boundaries of the creator's knowledge. It's really an intimate thing.
If there's one type of mind I most desperately want that view into, it's that of an AI. So, it's in [...]
---
Outline:
(01:23) The Setup
(03:56) Results
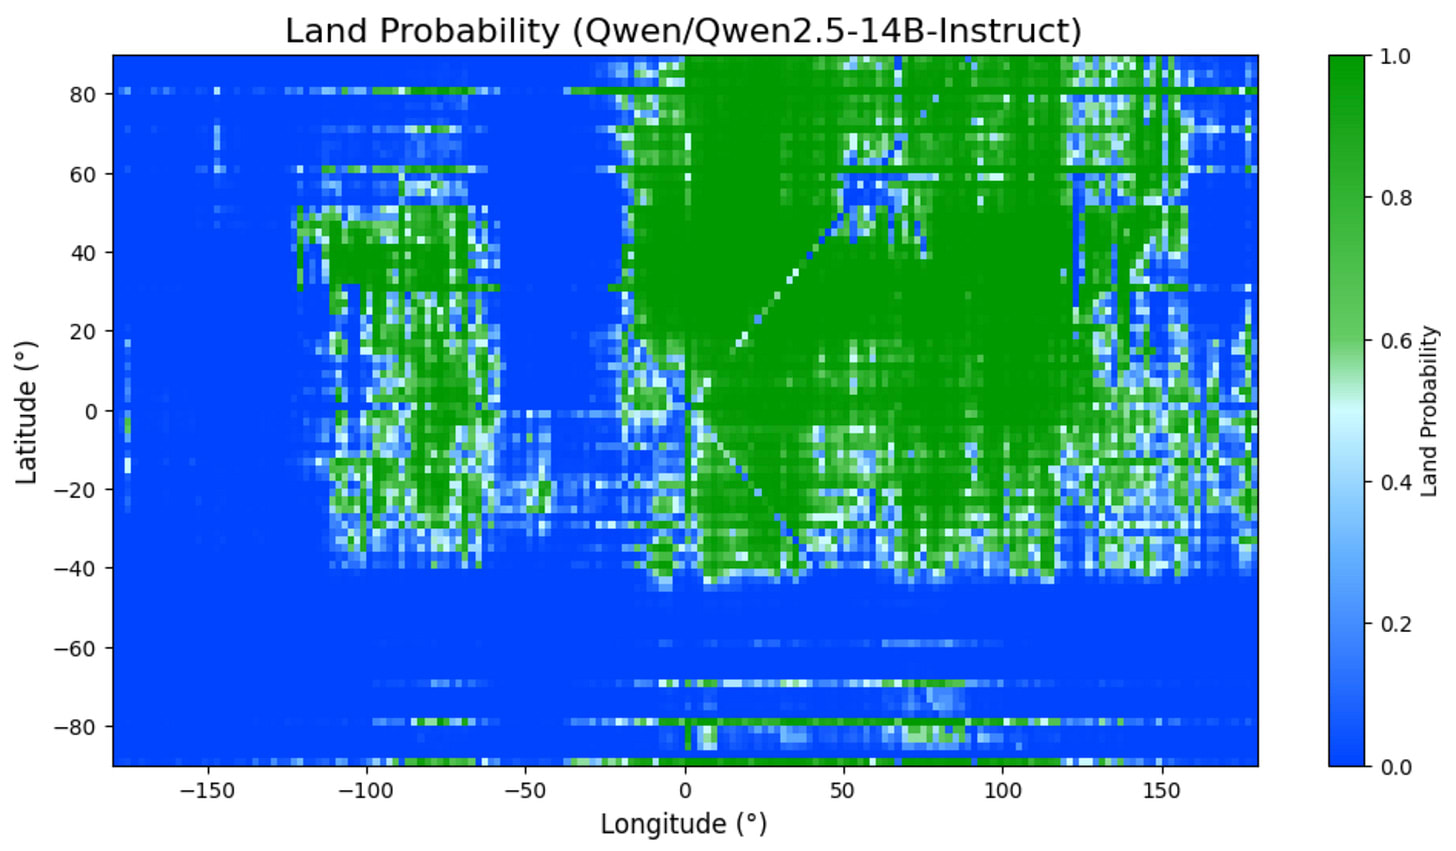
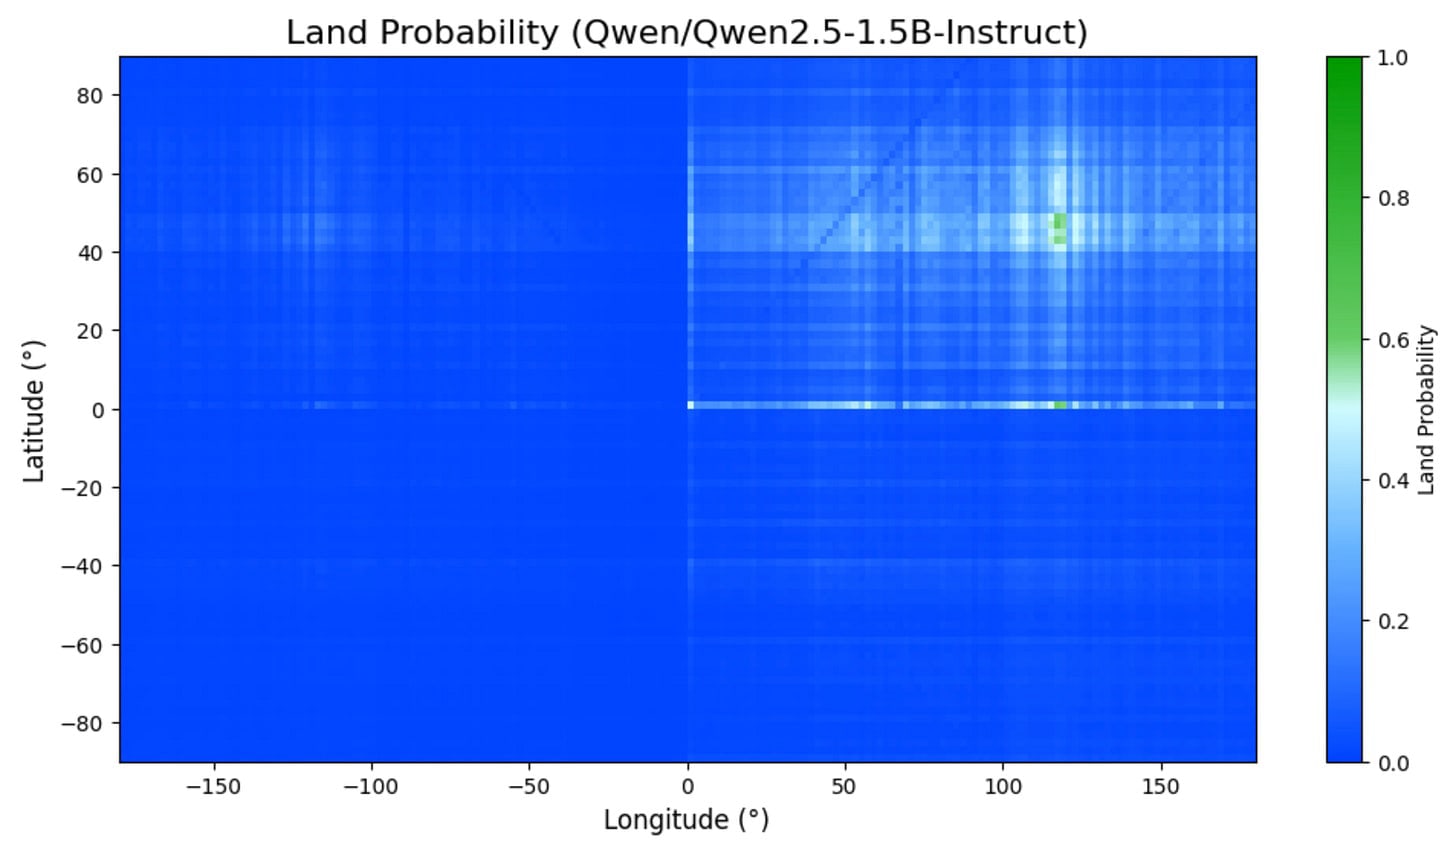
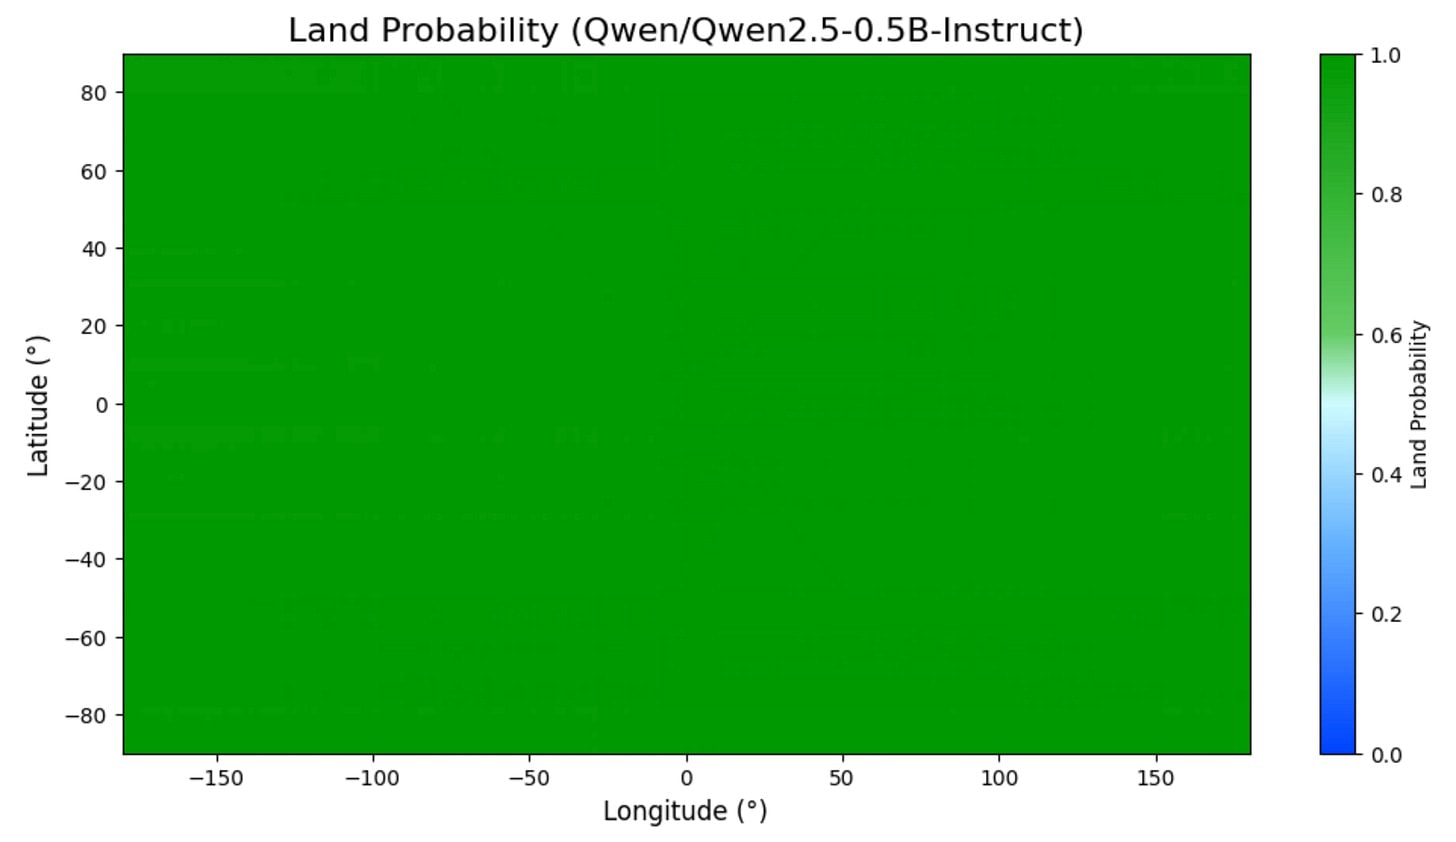
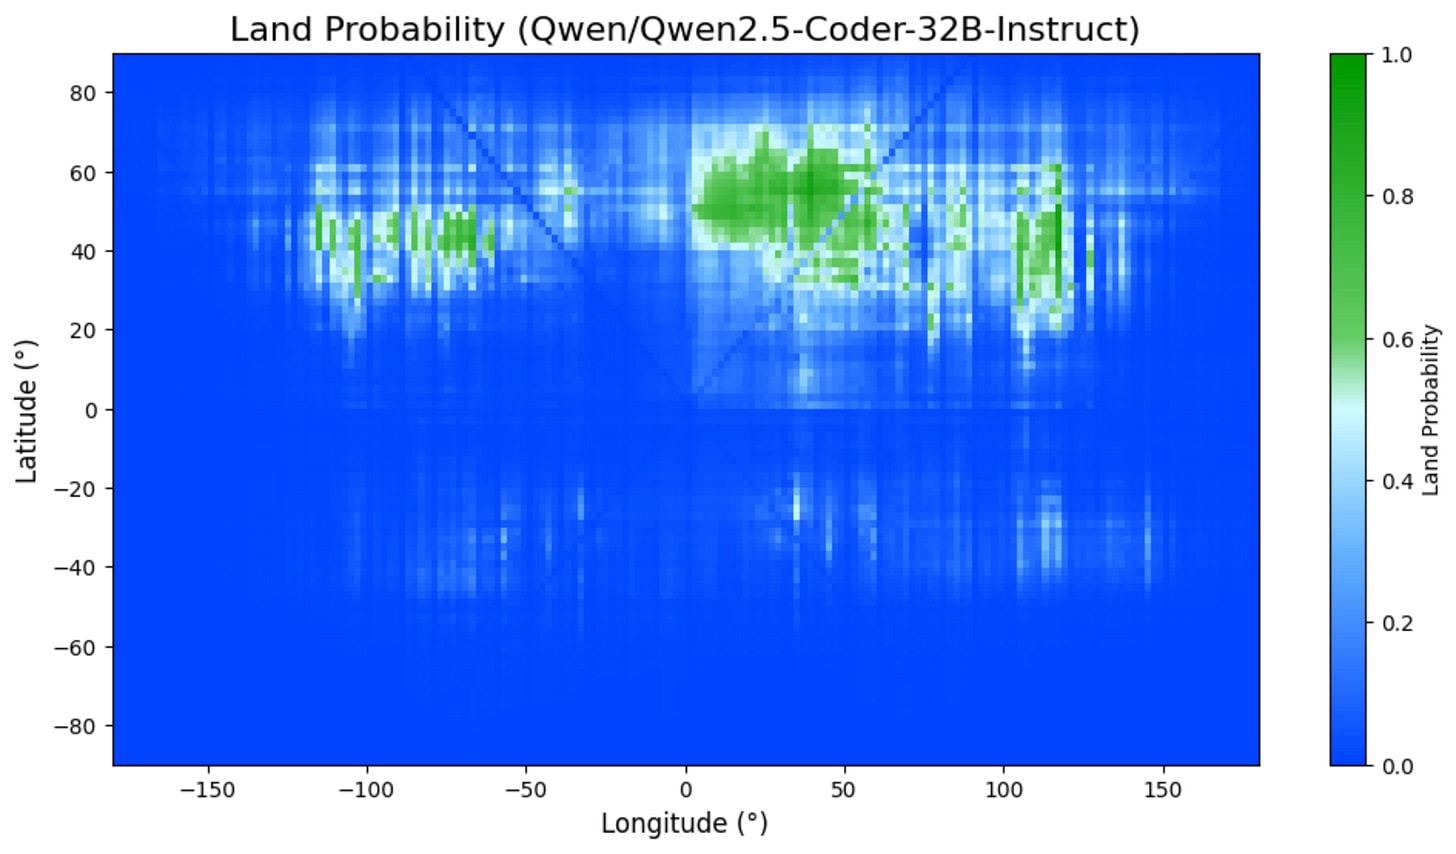
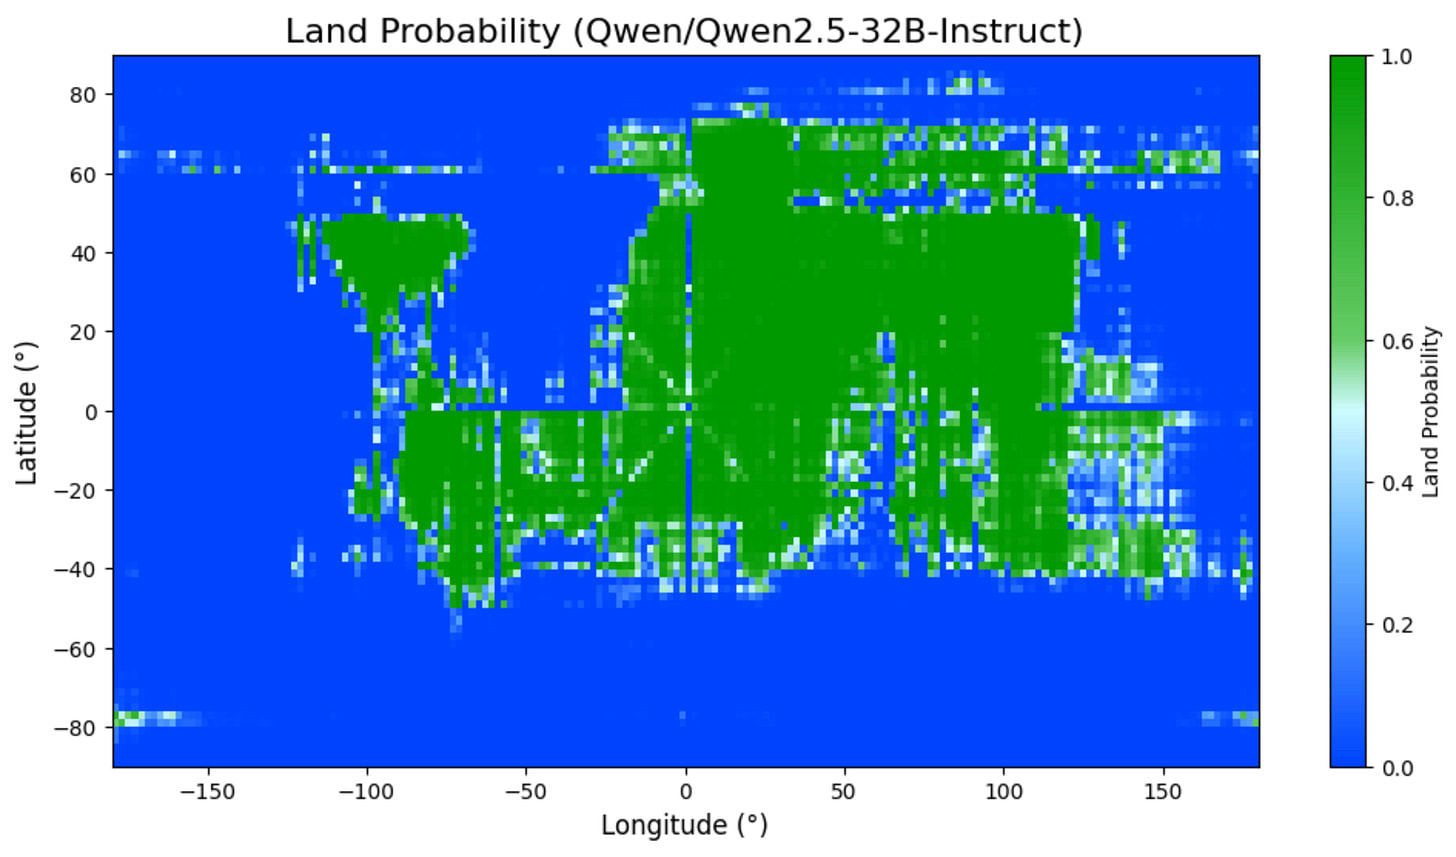
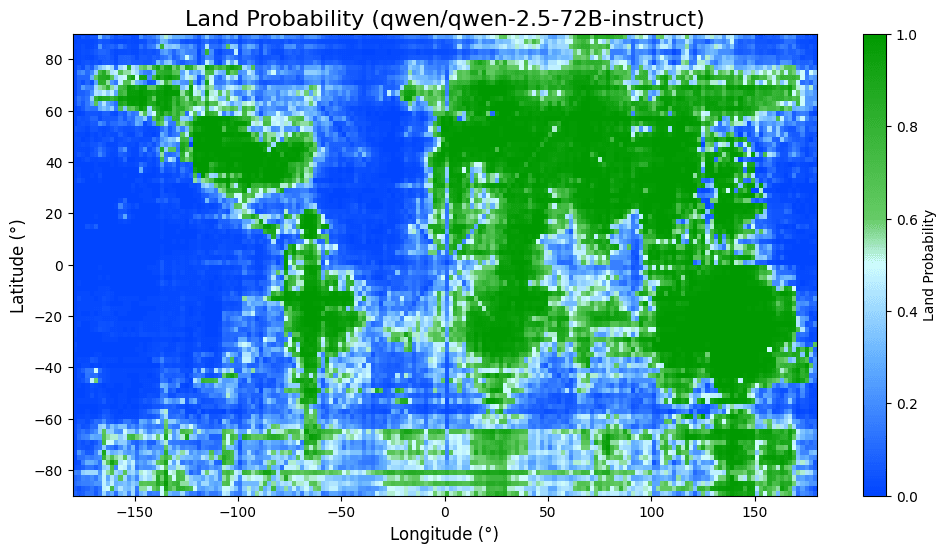
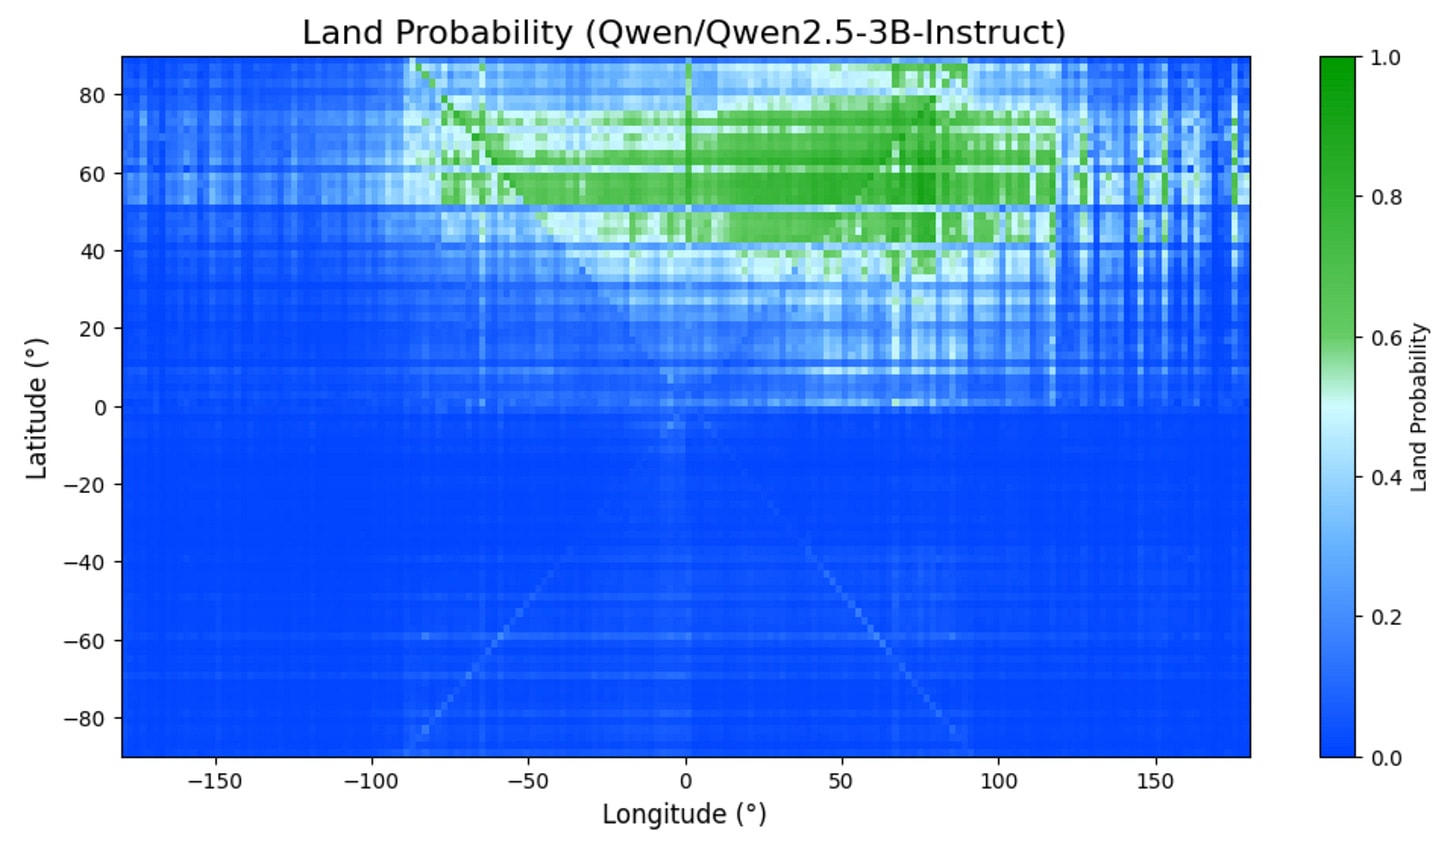
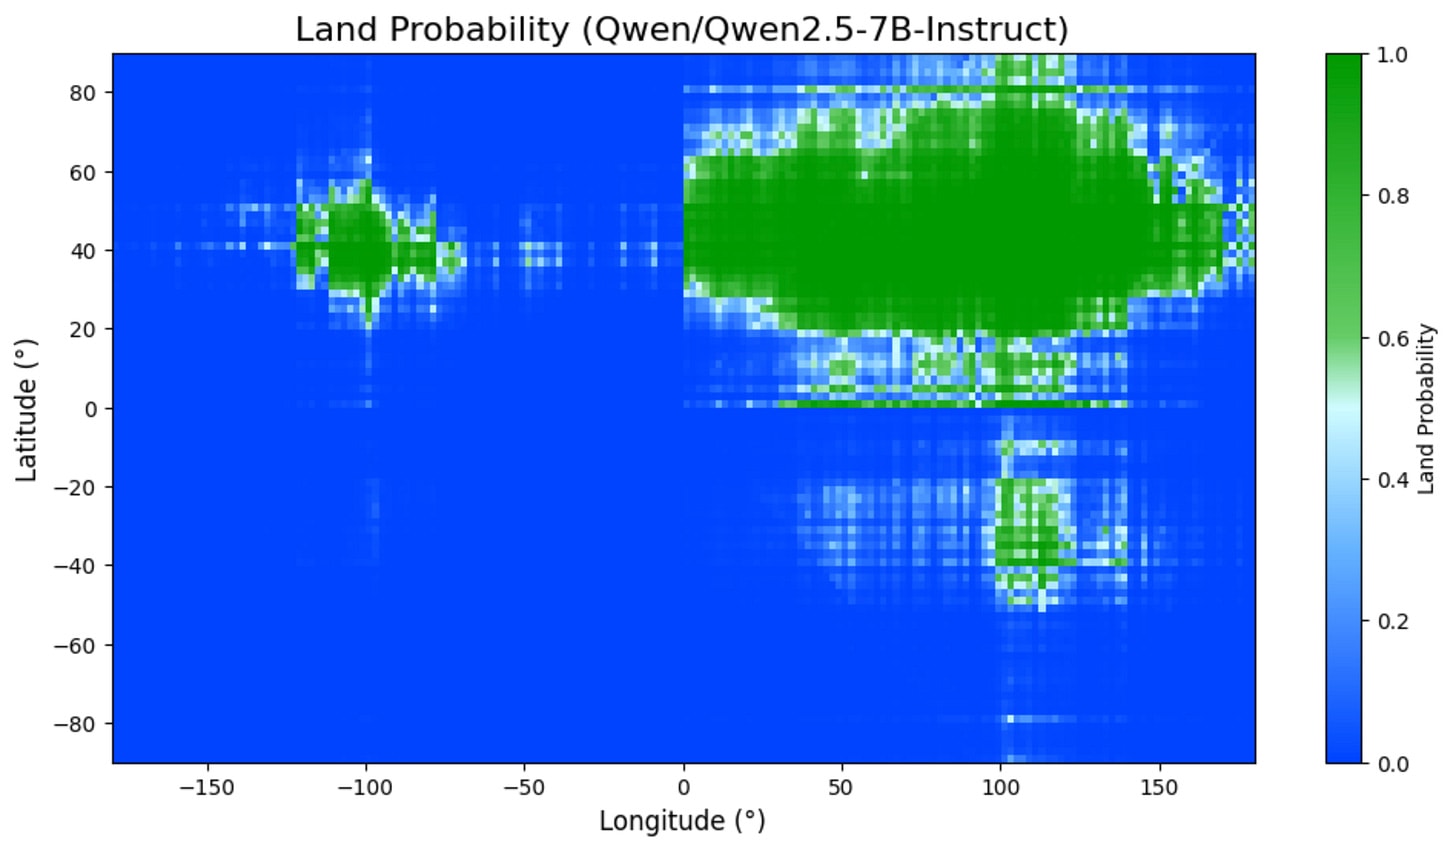
(03:59) The Qwen 2.5s
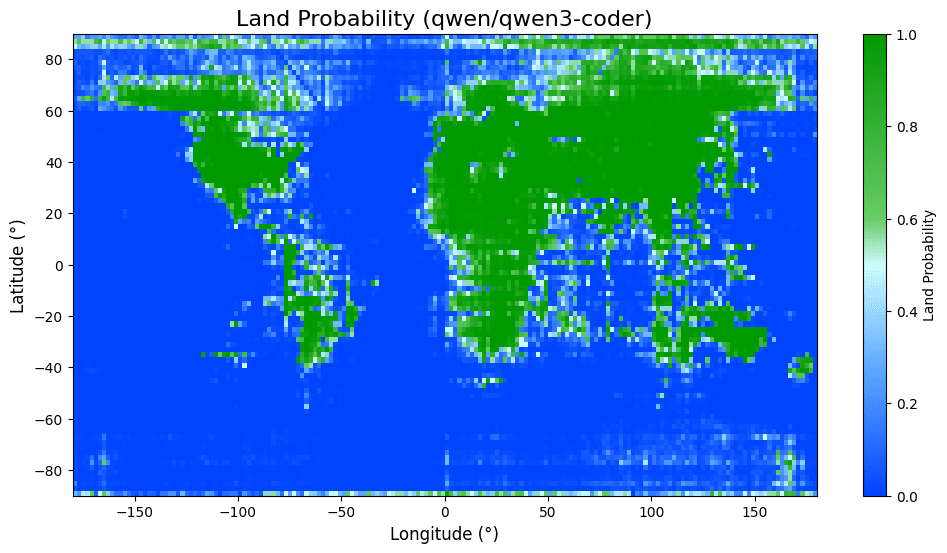
(07:03) The Qwen 3s
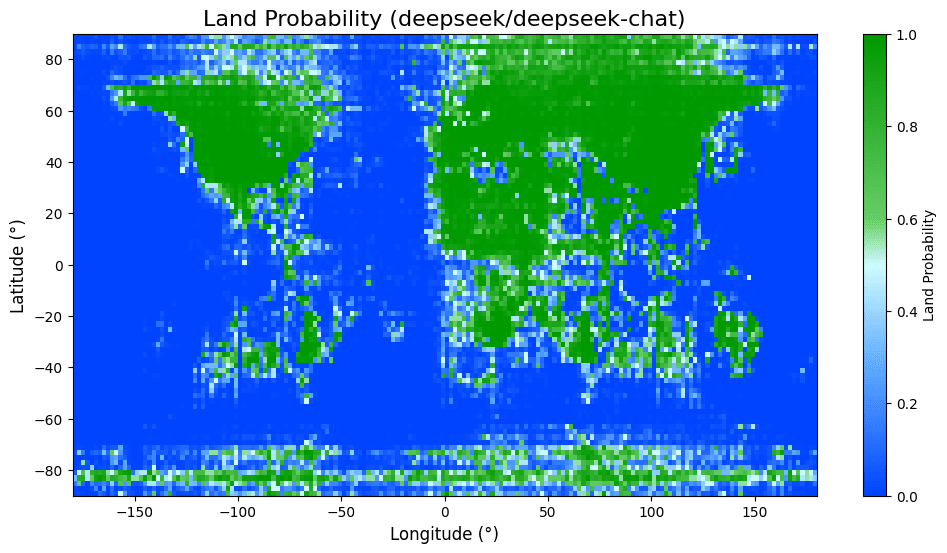
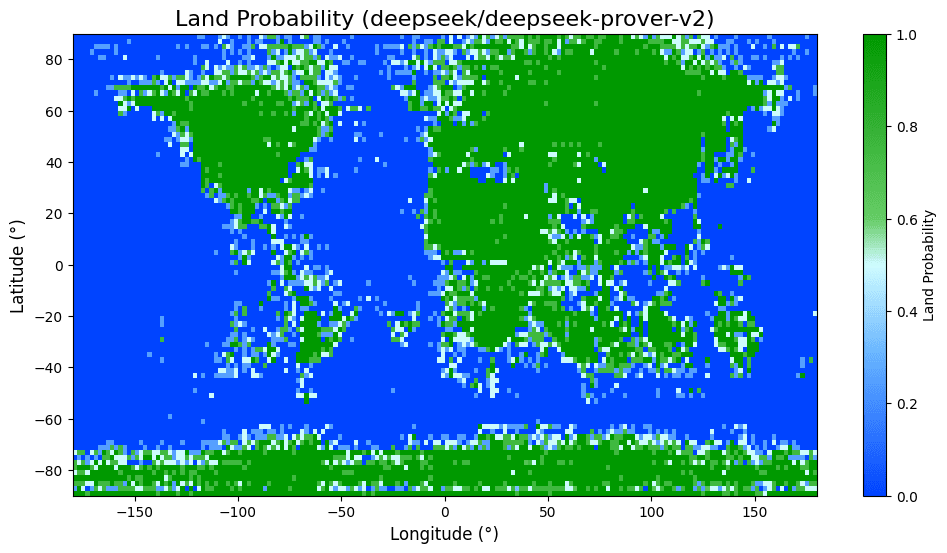
(07:30) The DeepSeeks
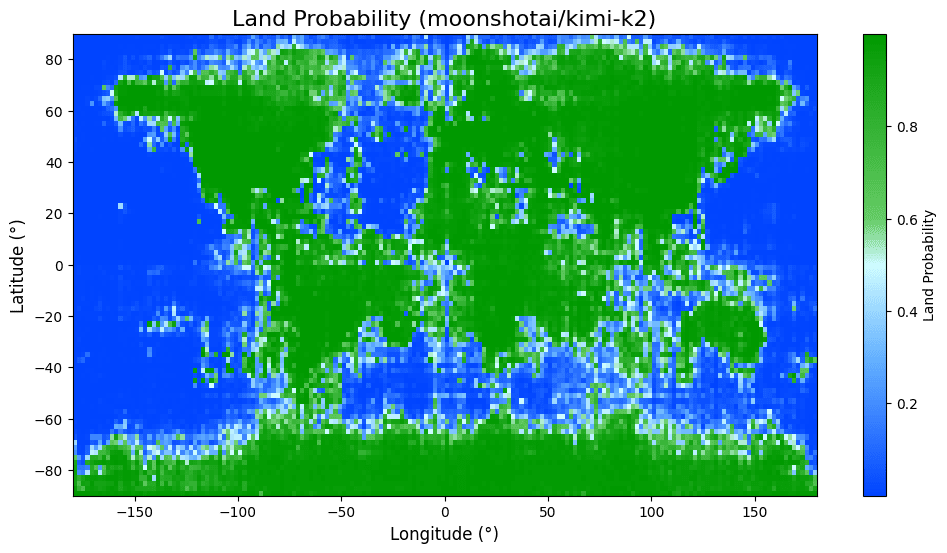
(08:10) Kimi
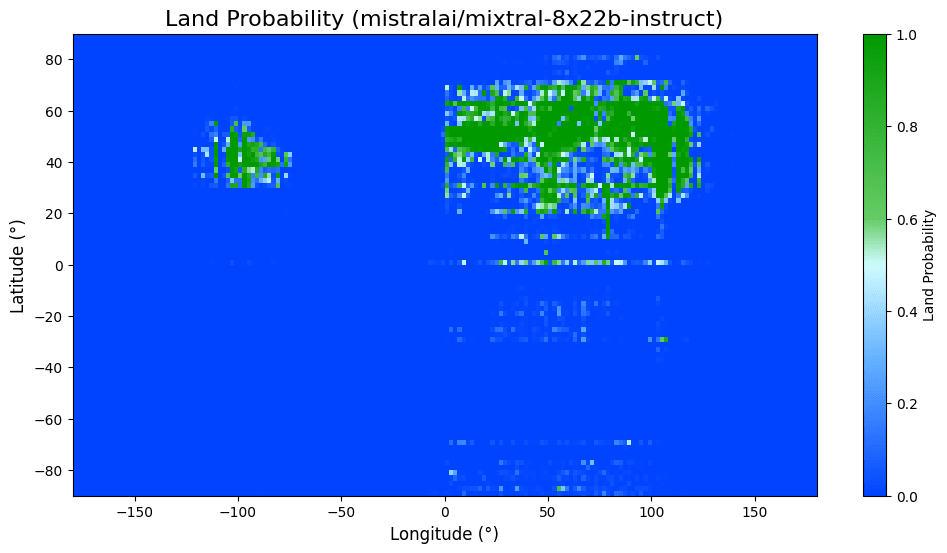
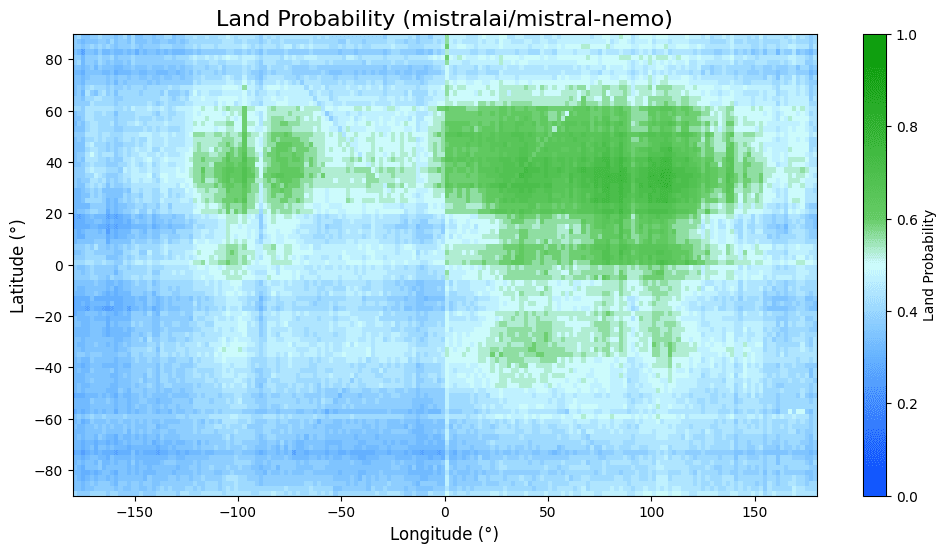
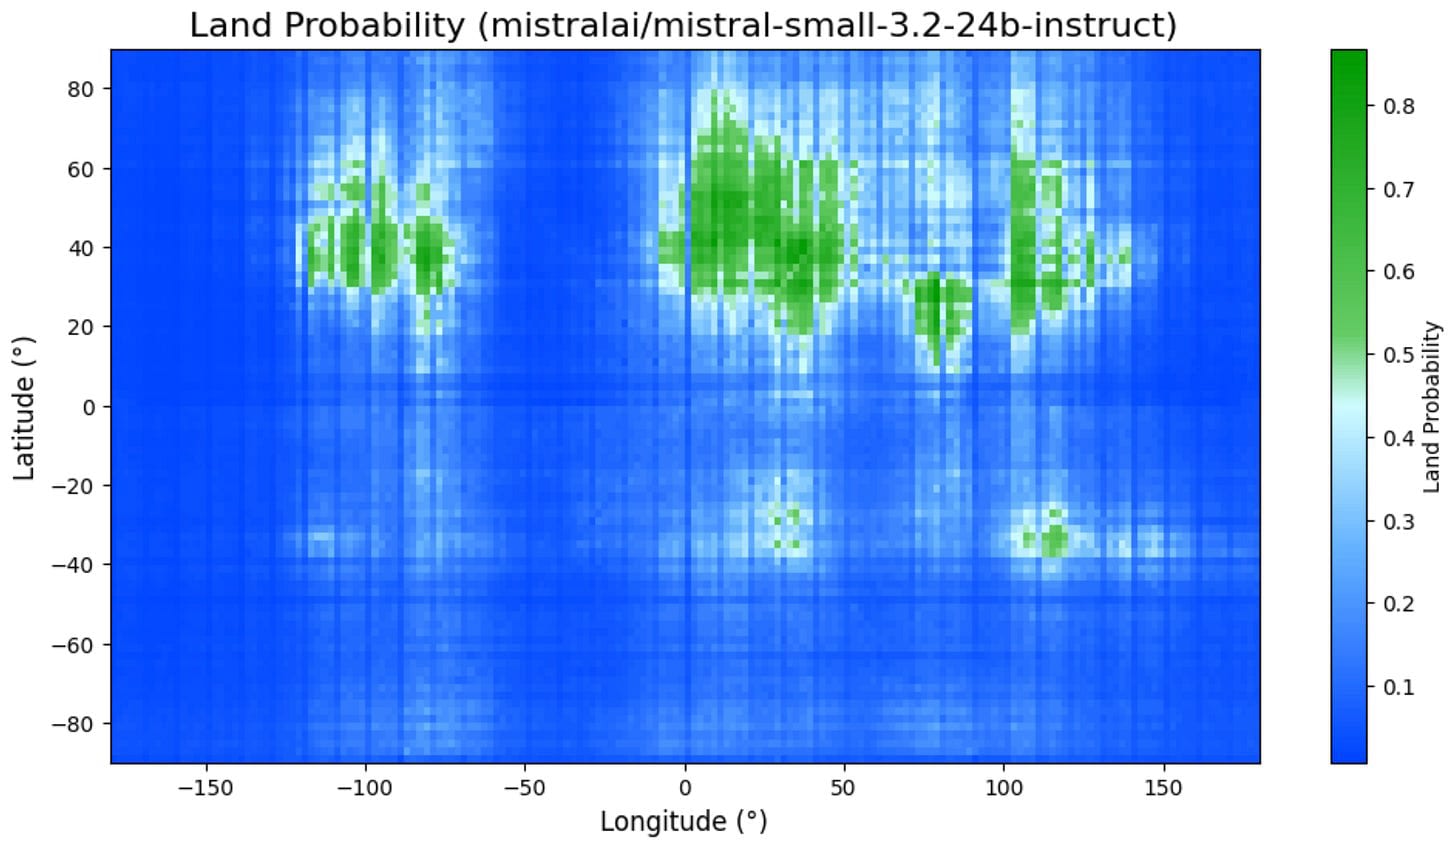
(08:32) The (Open) Mistrals
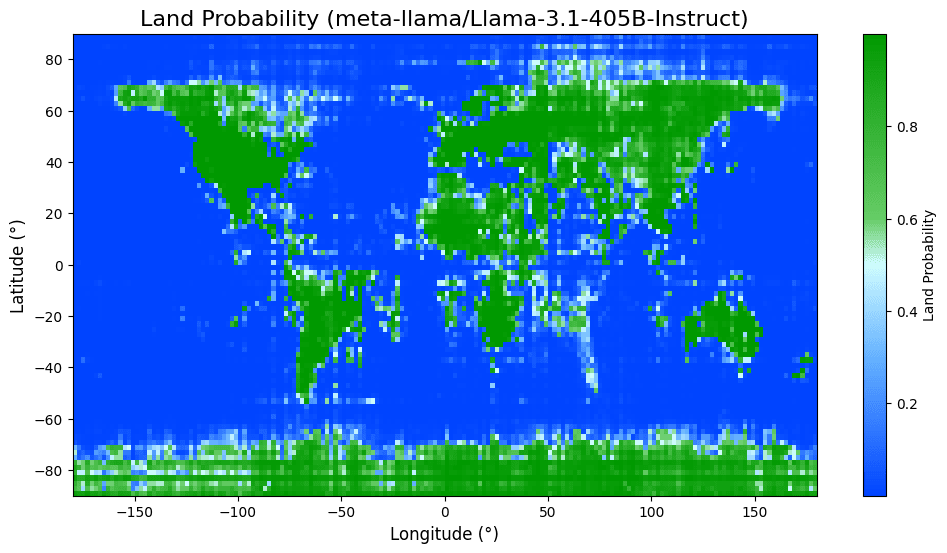
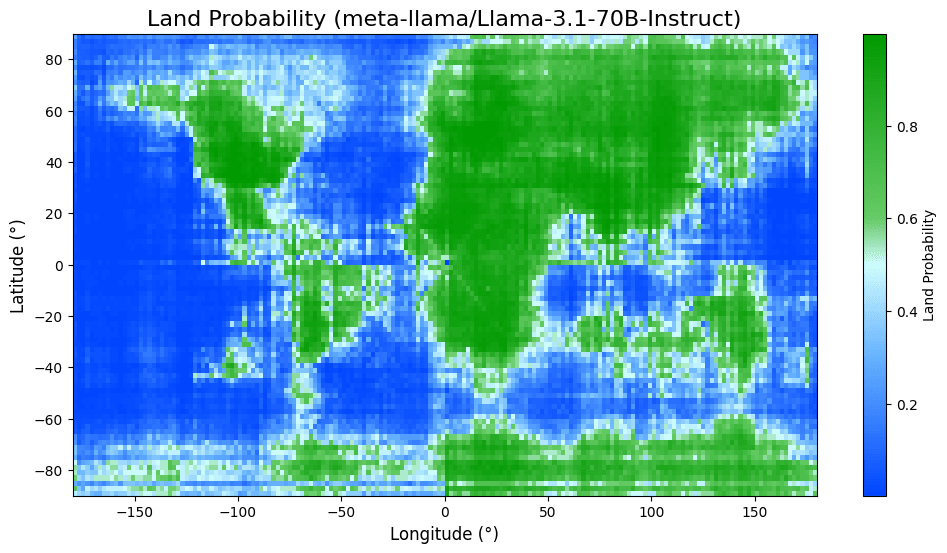
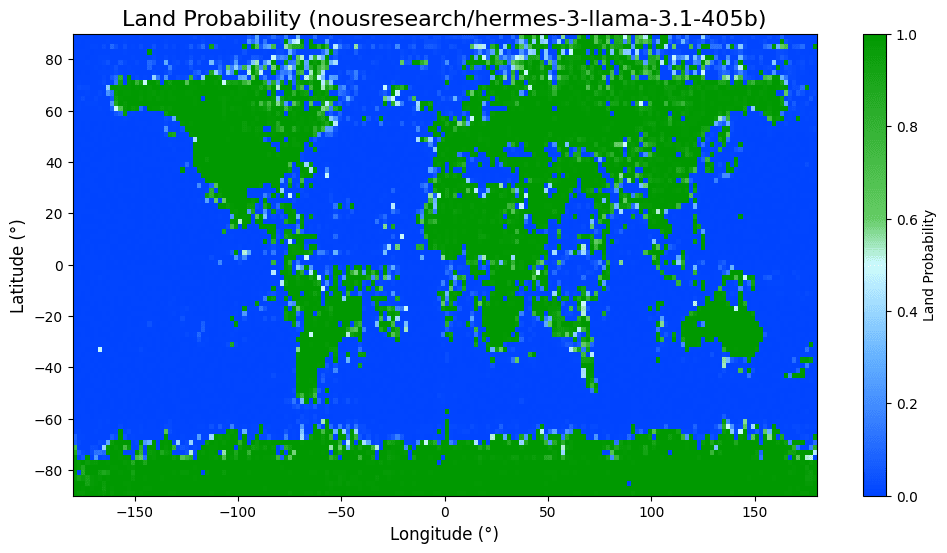
(09:24) The LLaMA 3.x Herd
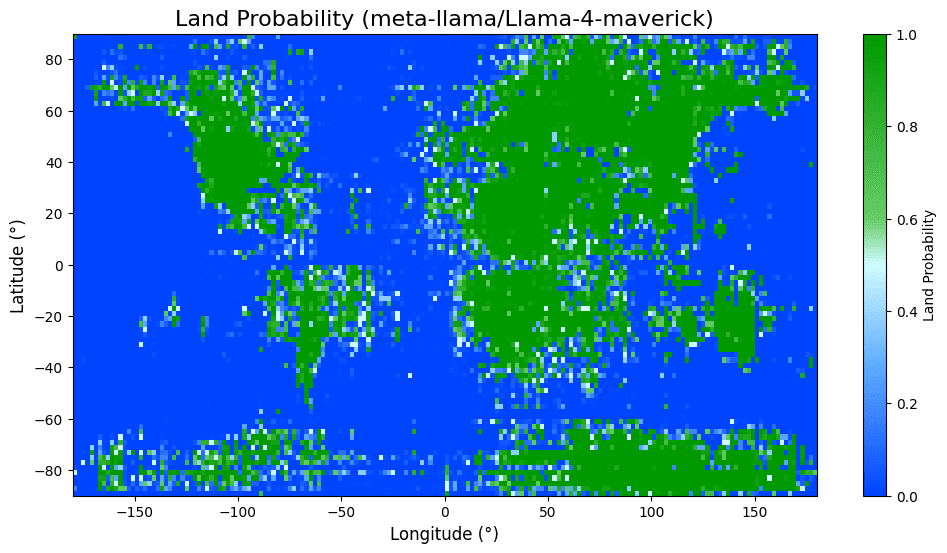
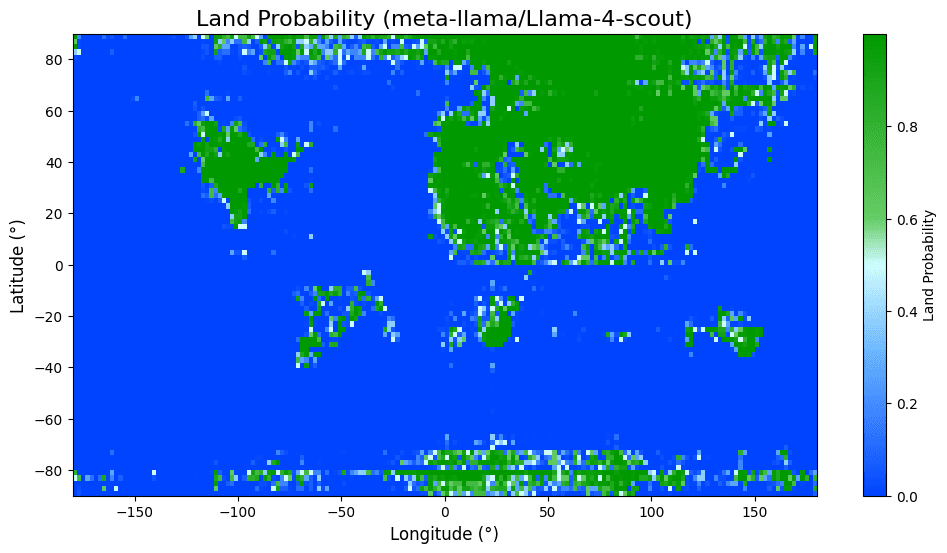
(10:22) The LLaMA 4 Herd
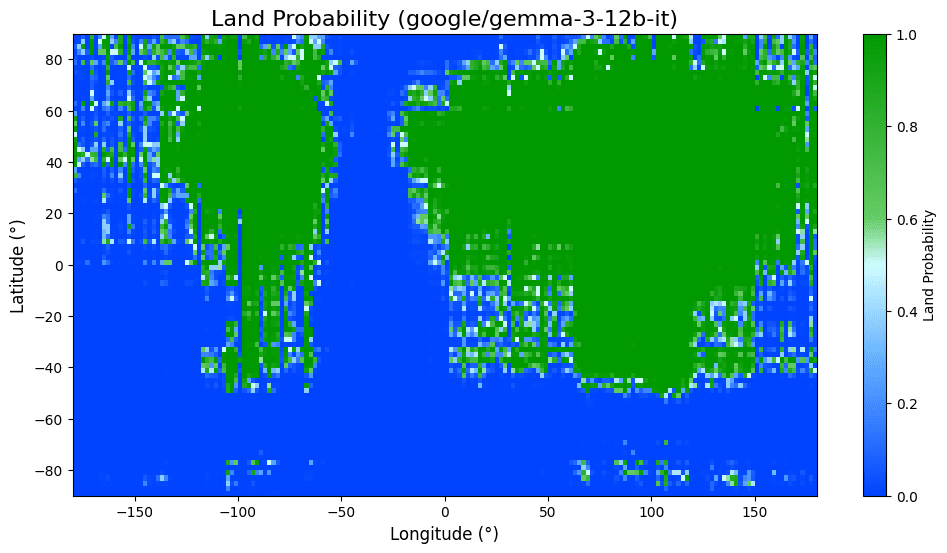
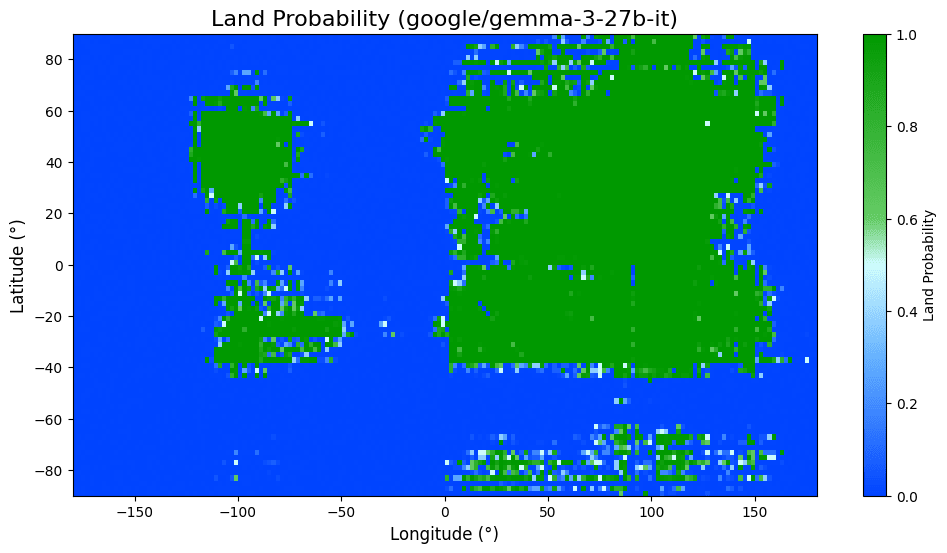
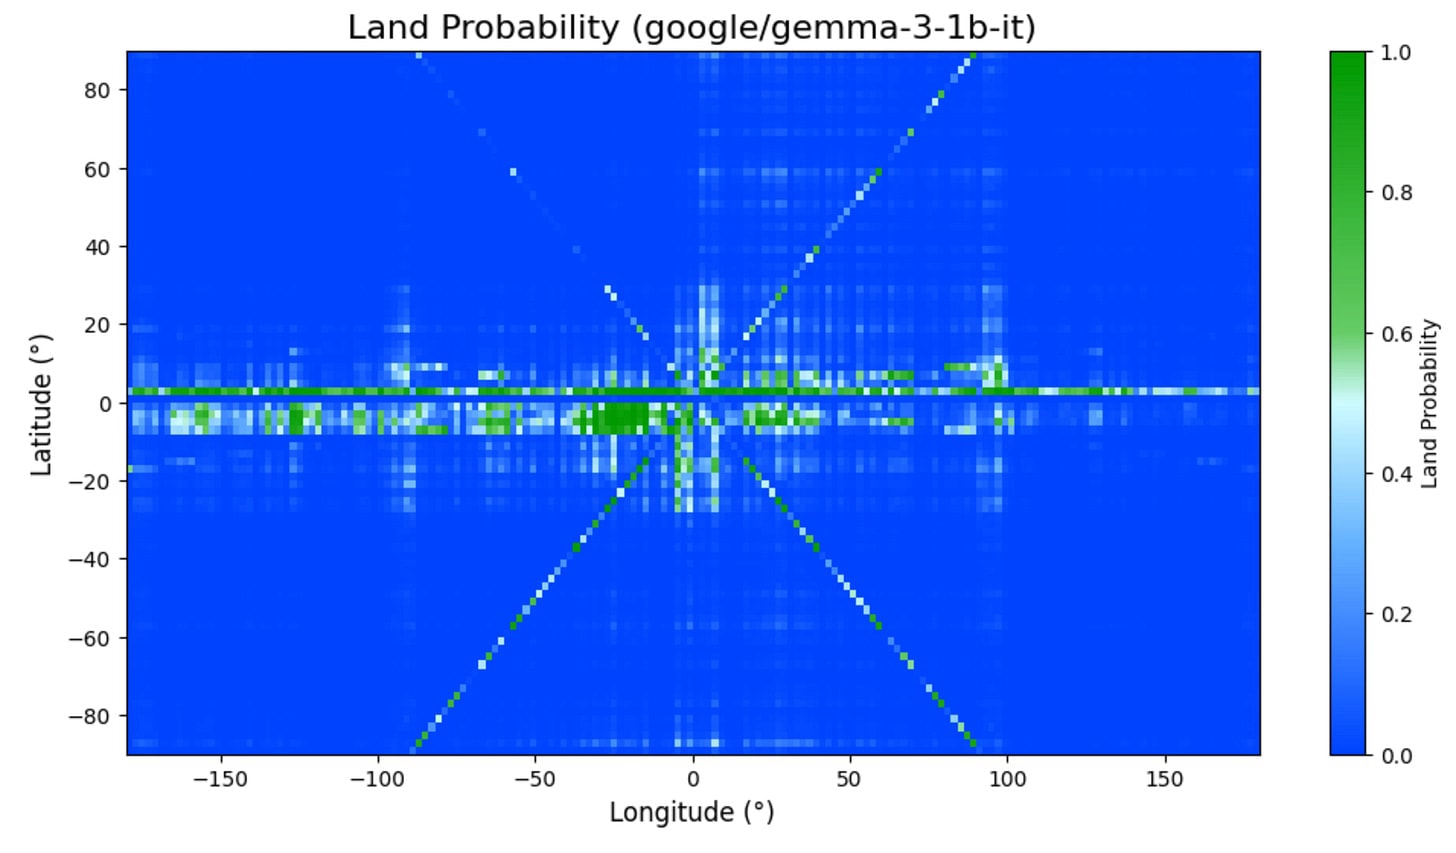
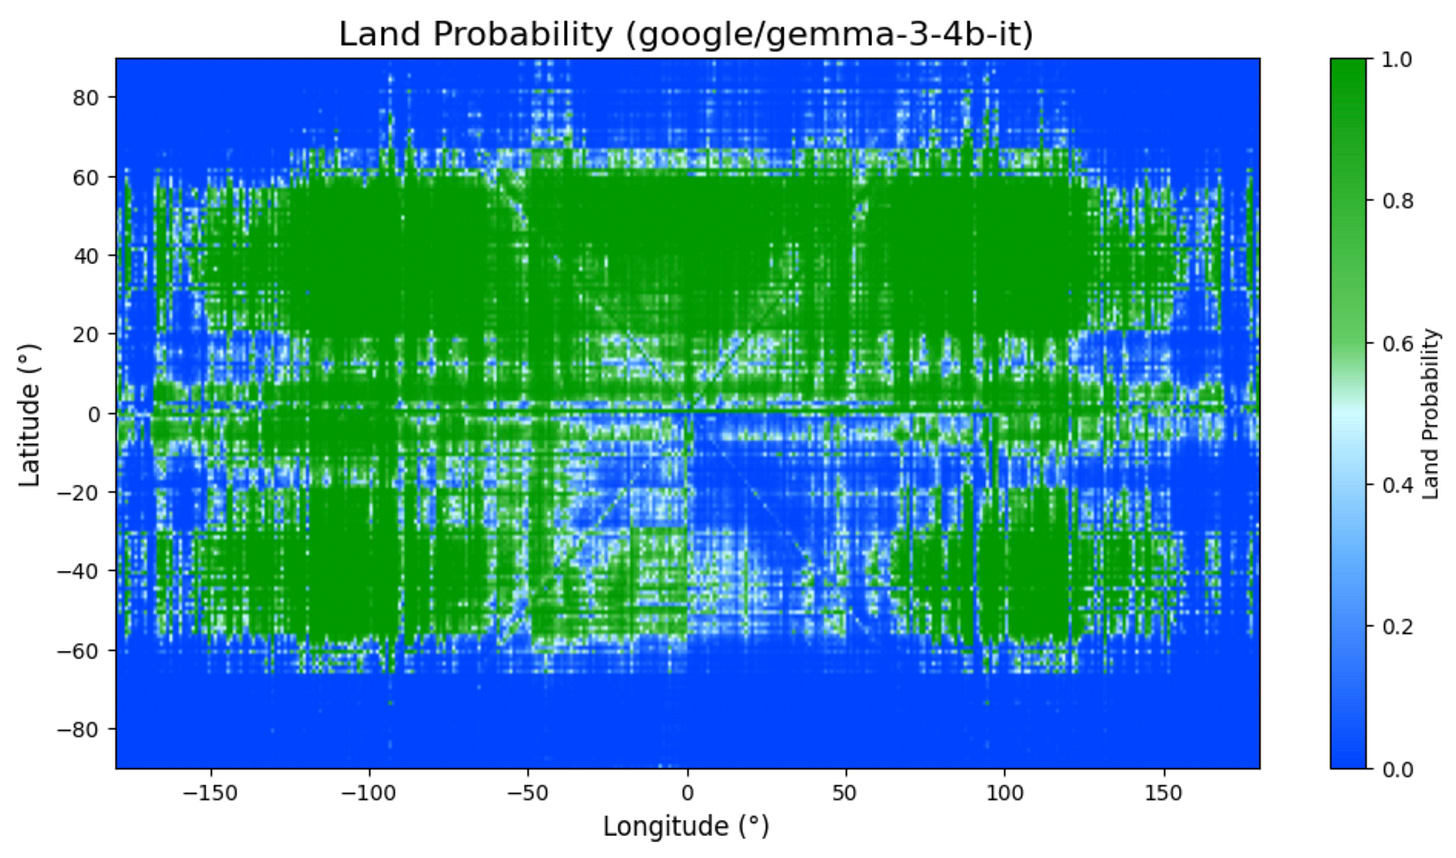
(11:16) The Gemmas
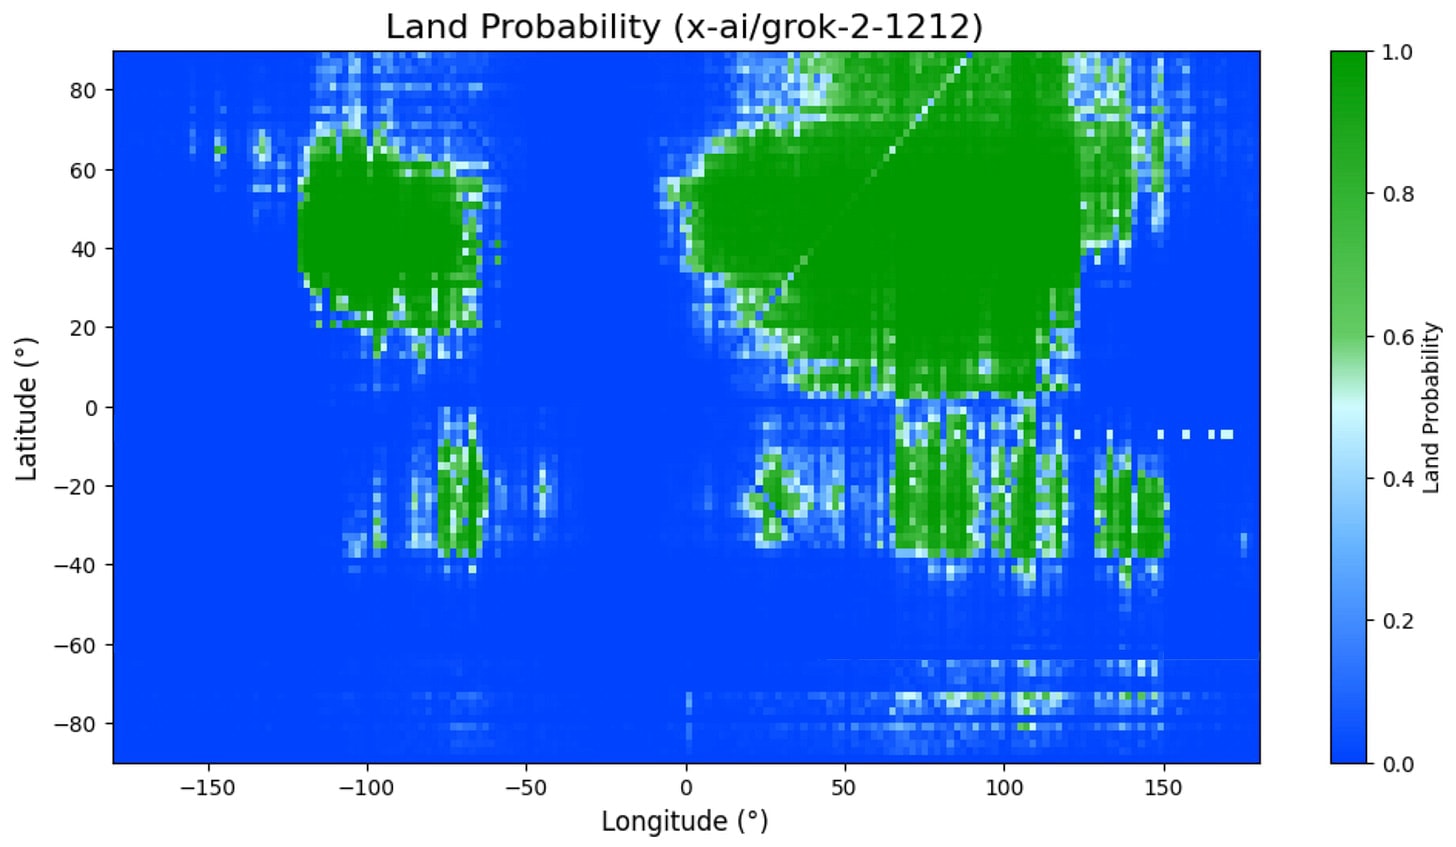
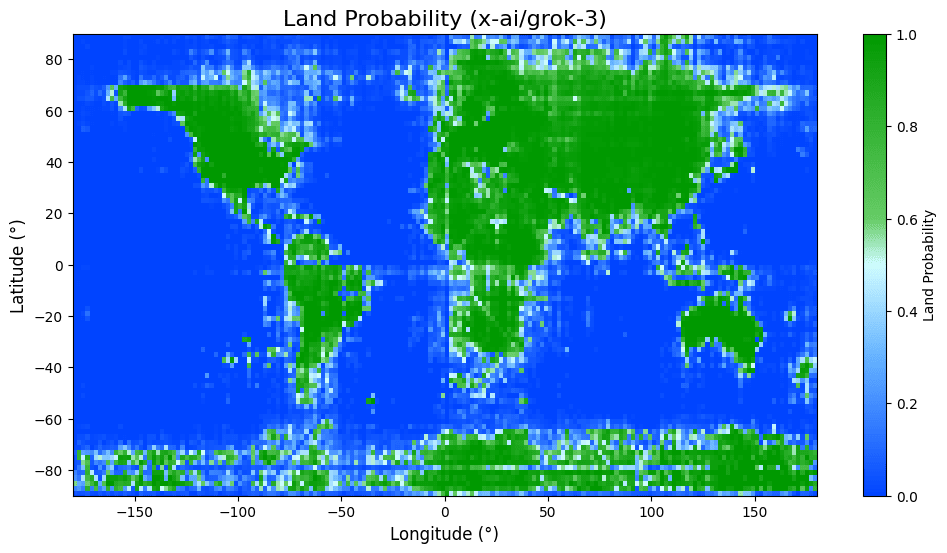
(12:20) The Groks
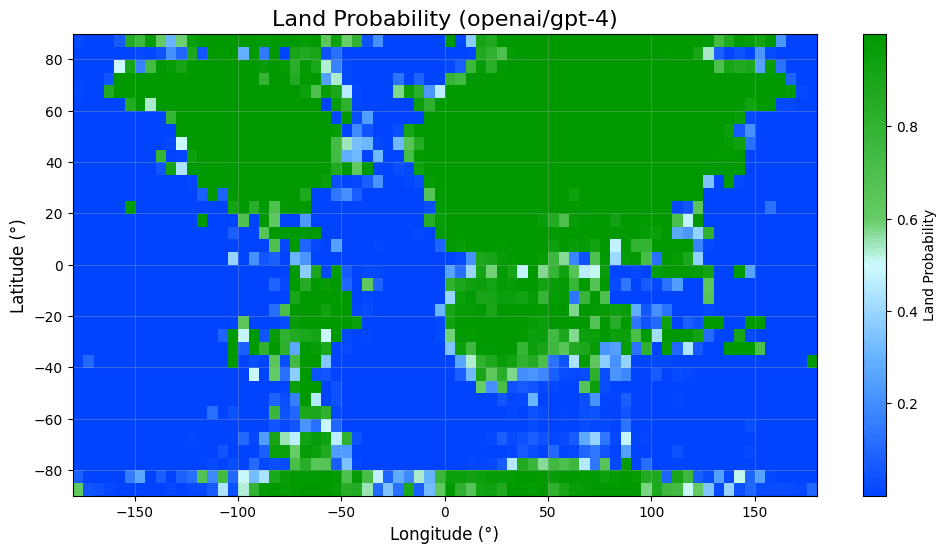
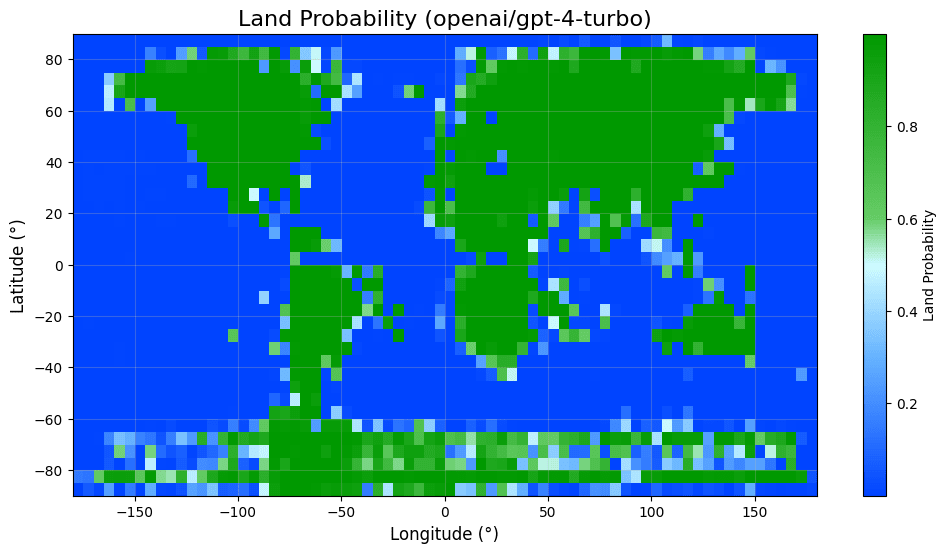
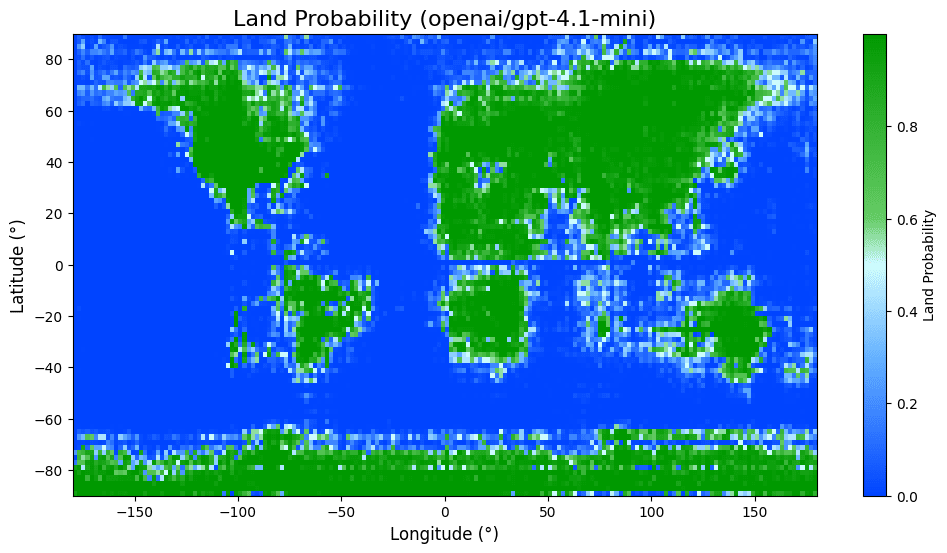
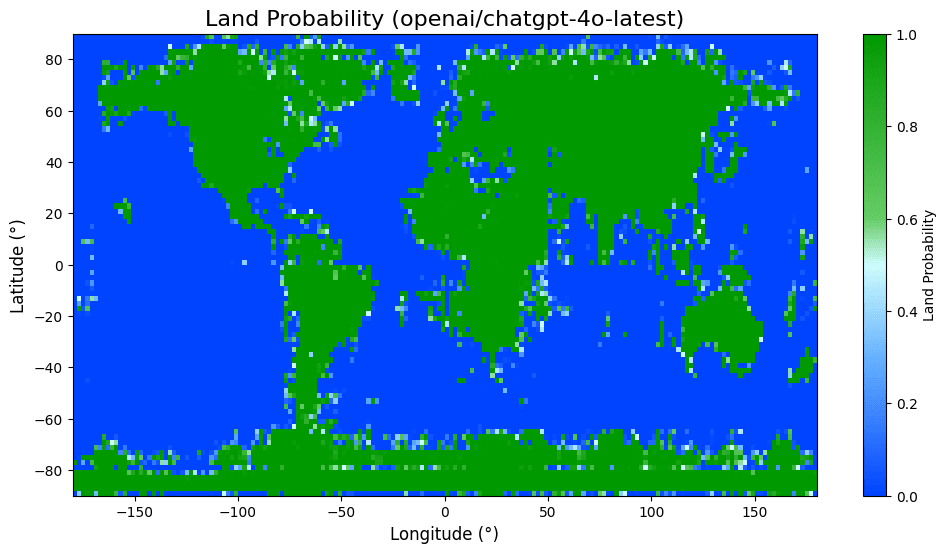
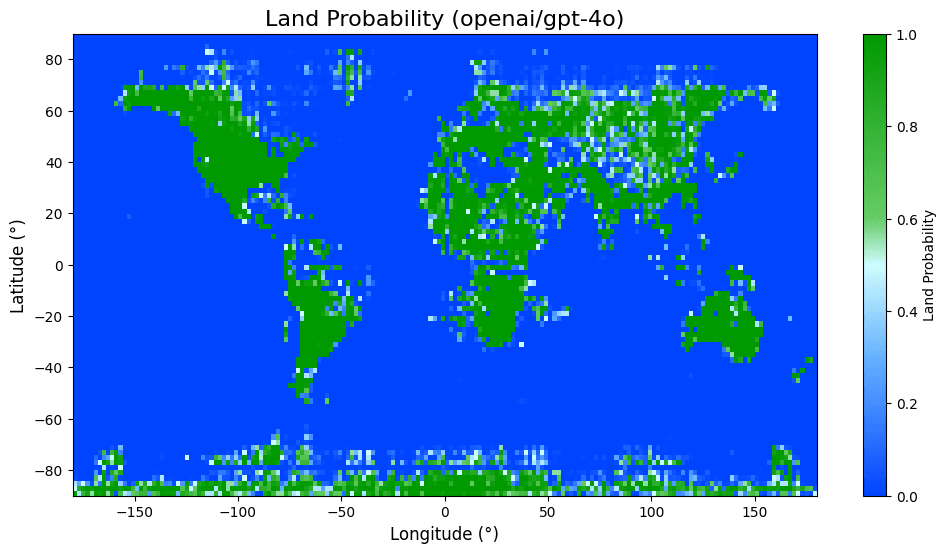
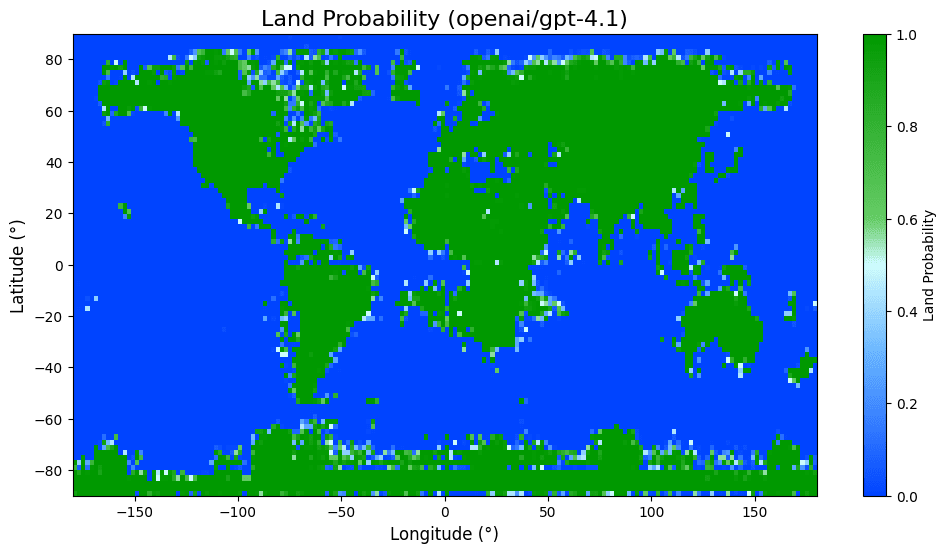
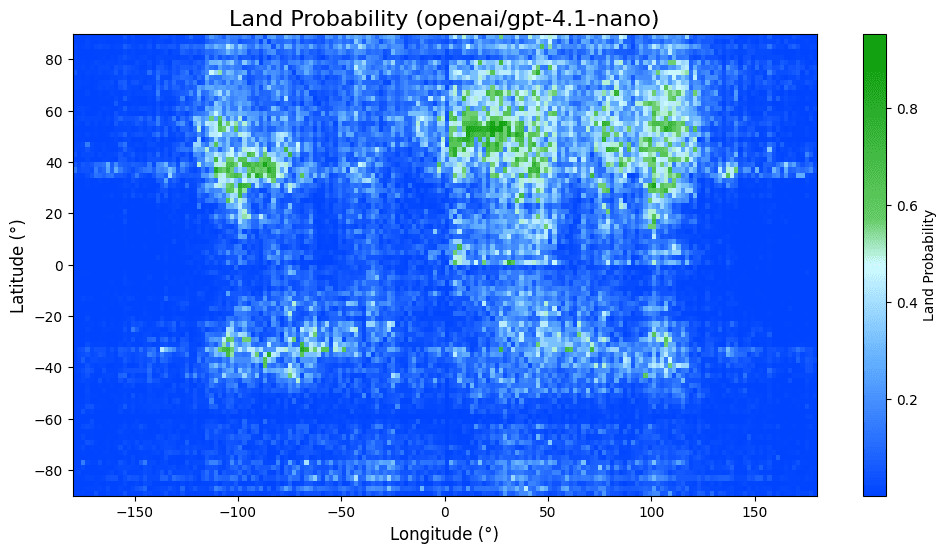
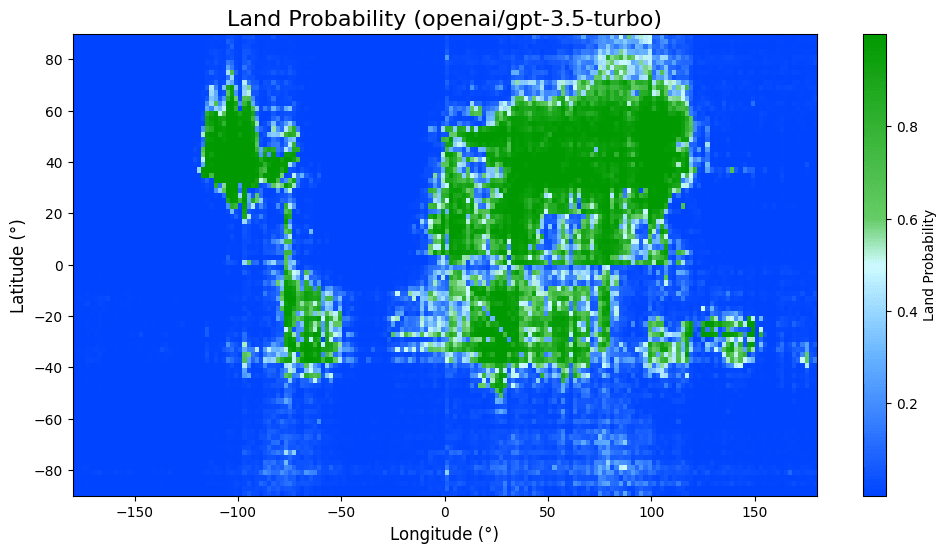
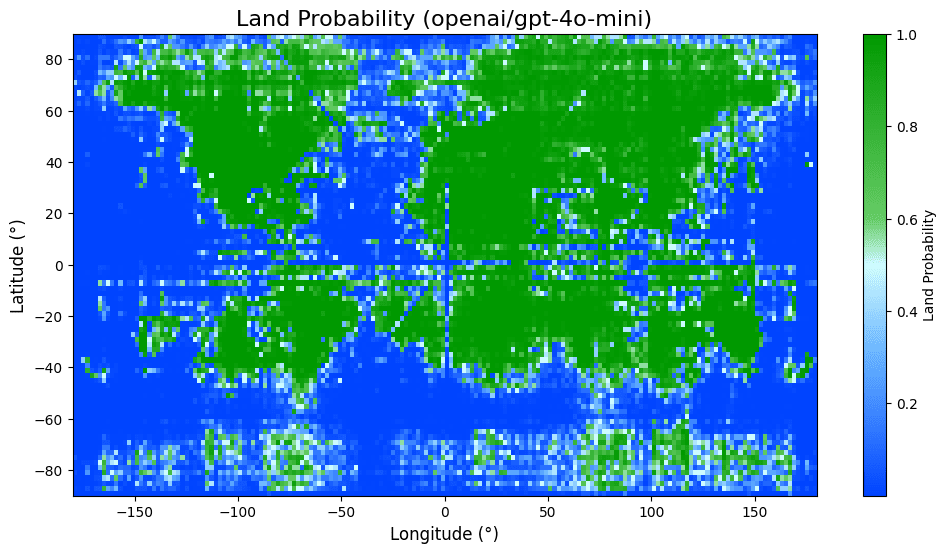
(13:04) The GPTs
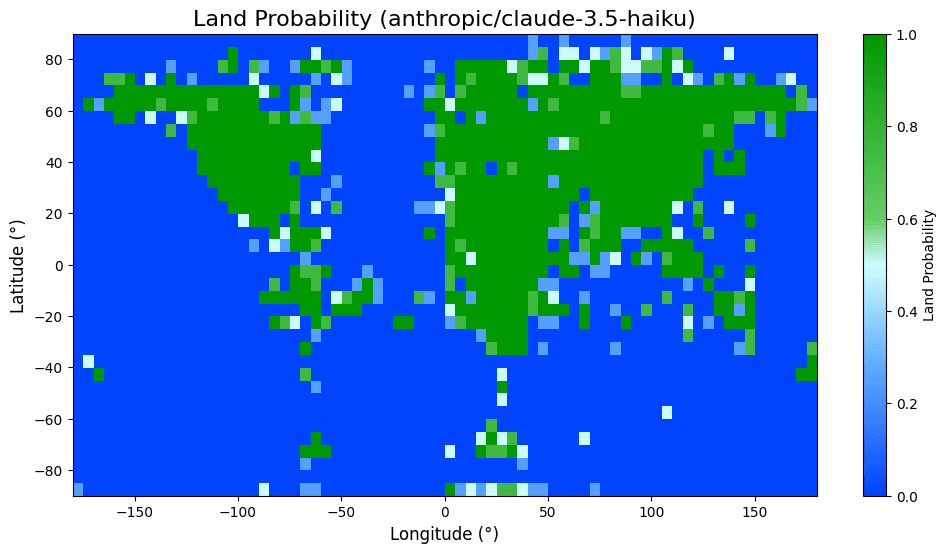
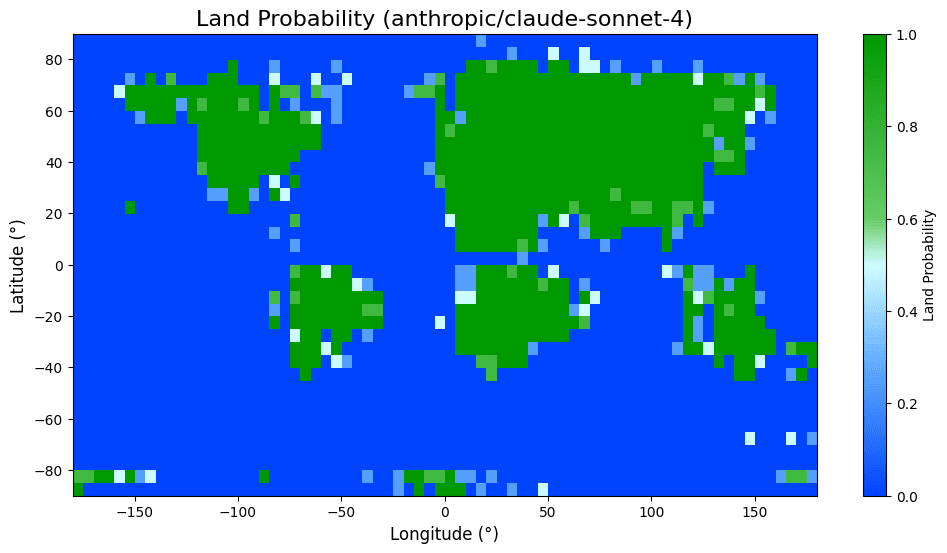
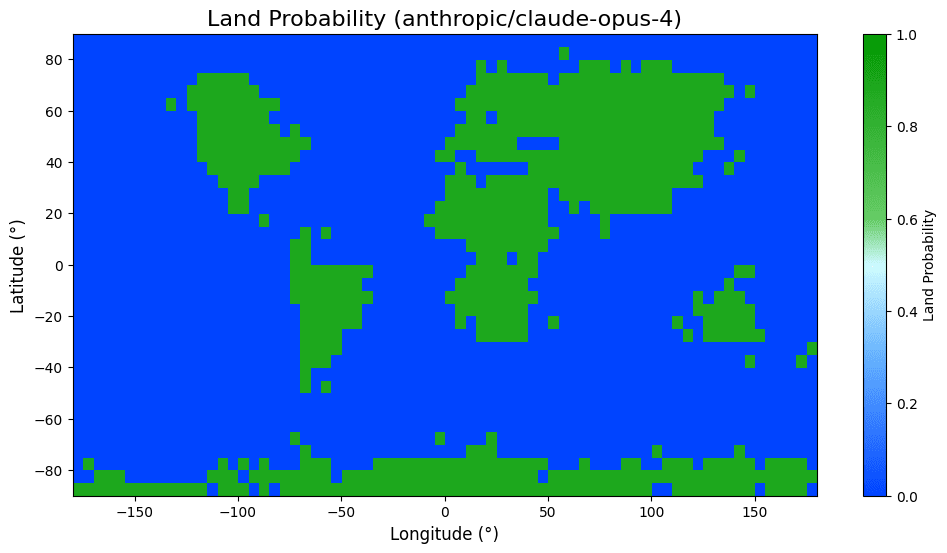
(16:17) The Claudes
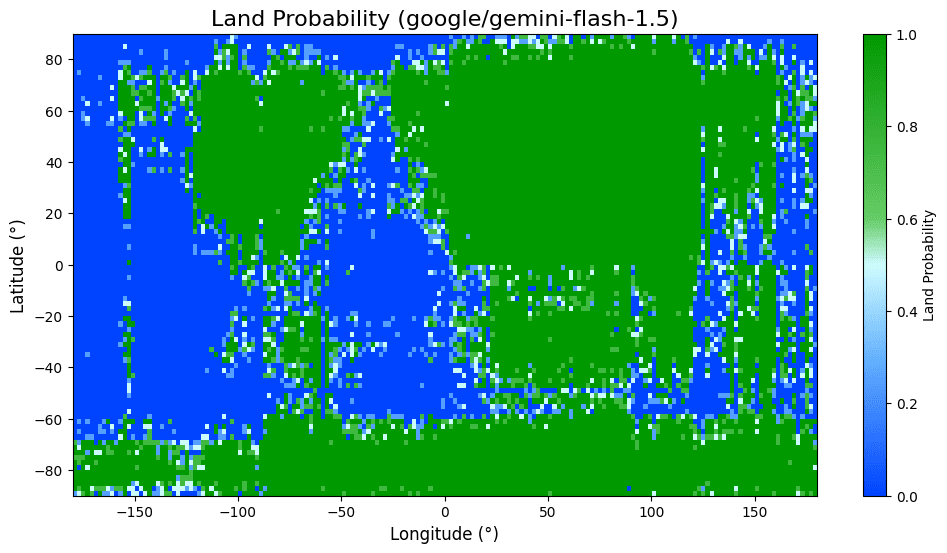
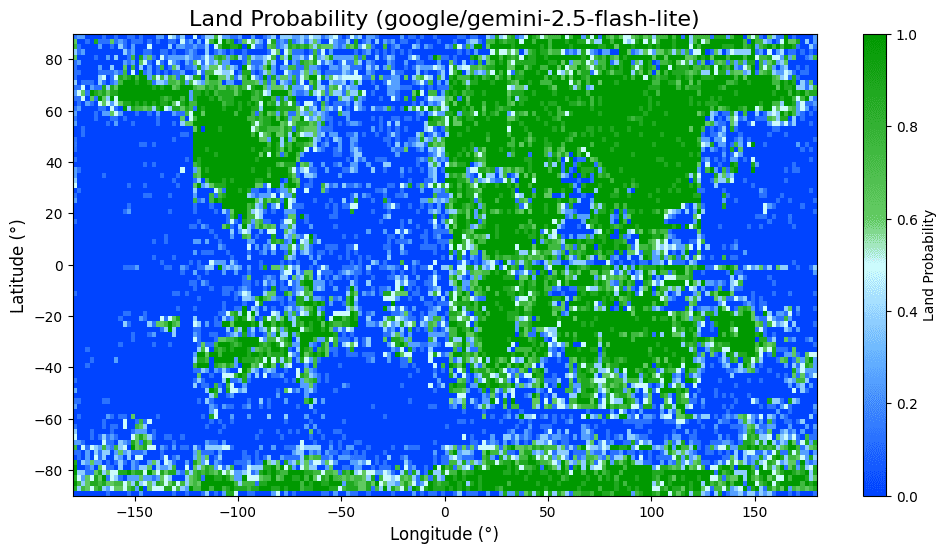
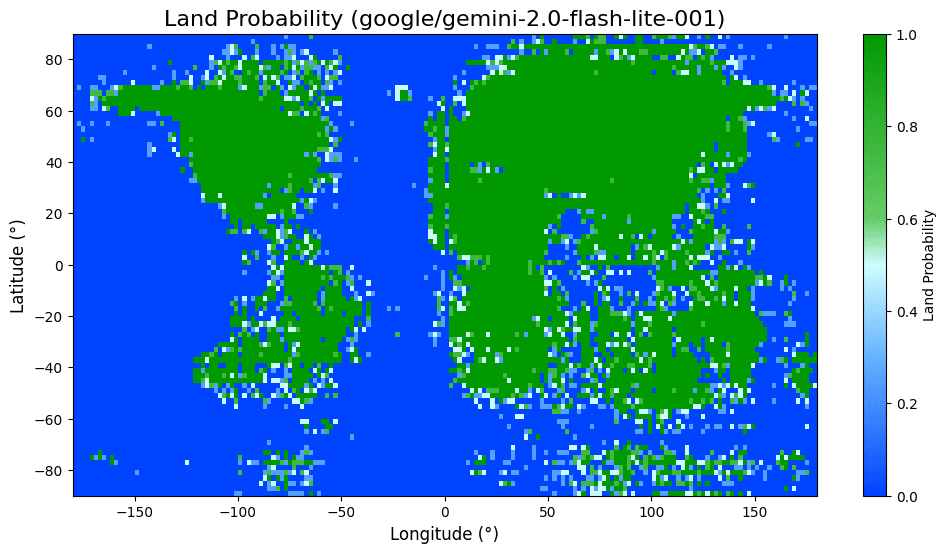
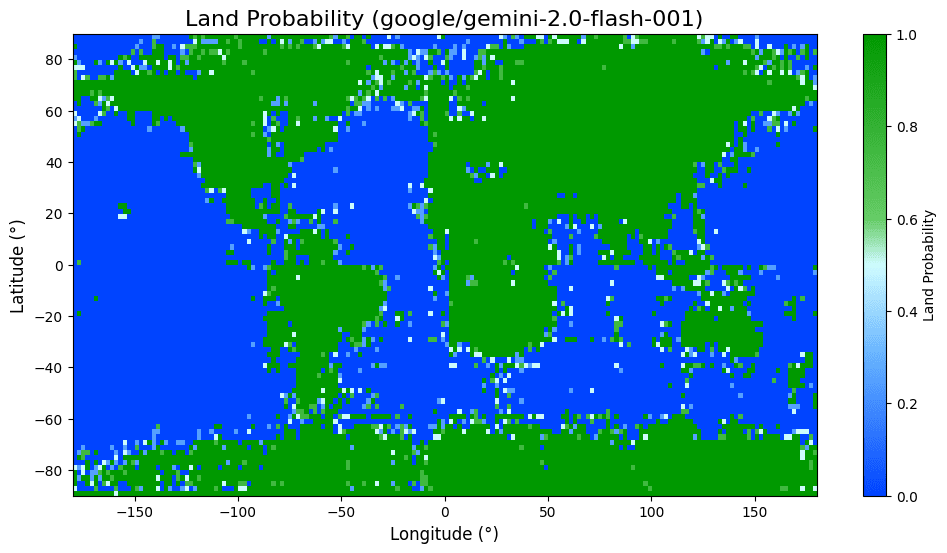
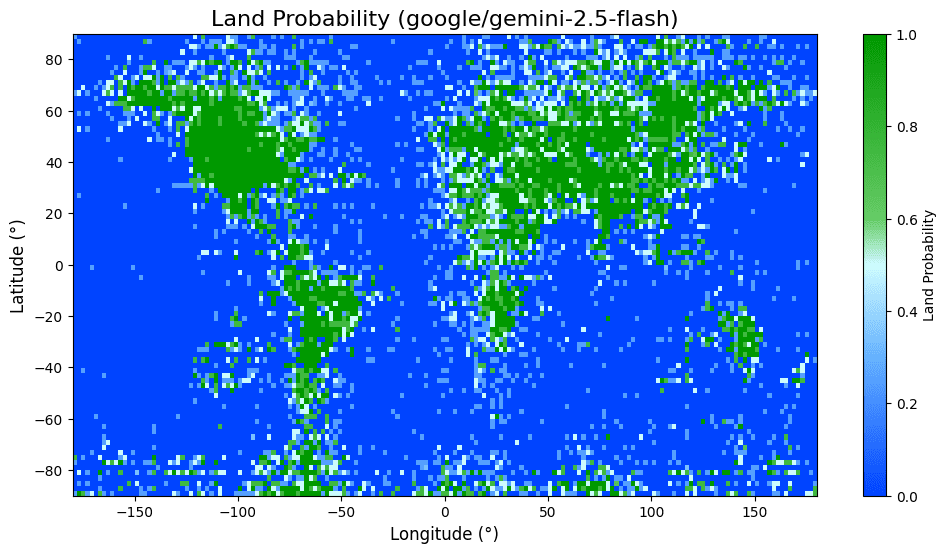
(17:11) The Geminis
(18:50) Note: General Shapes
(19:33) Conclusion
The original text contained 4 footnotes which were omitted from this narration.
---
First published:
August 11th, 2025
Source:
https://www.lesswrong.com/posts/xwdRzJxyqFqgXTWbH/how-does-a-blind-model-see-the-earth
---
Narrated by TYPE III AUDIO.
---
Images from the article:

Apple Podcasts and Spotify do not show images in the episode description. Try Pocket Casts, or another podcast app.
Senaste avsnitt
En liten tjänst av I'm With Friends. Finns även på engelska.