
“How Does Time Horizon Vary Across Domains?” by Thomas Kwa
Summary
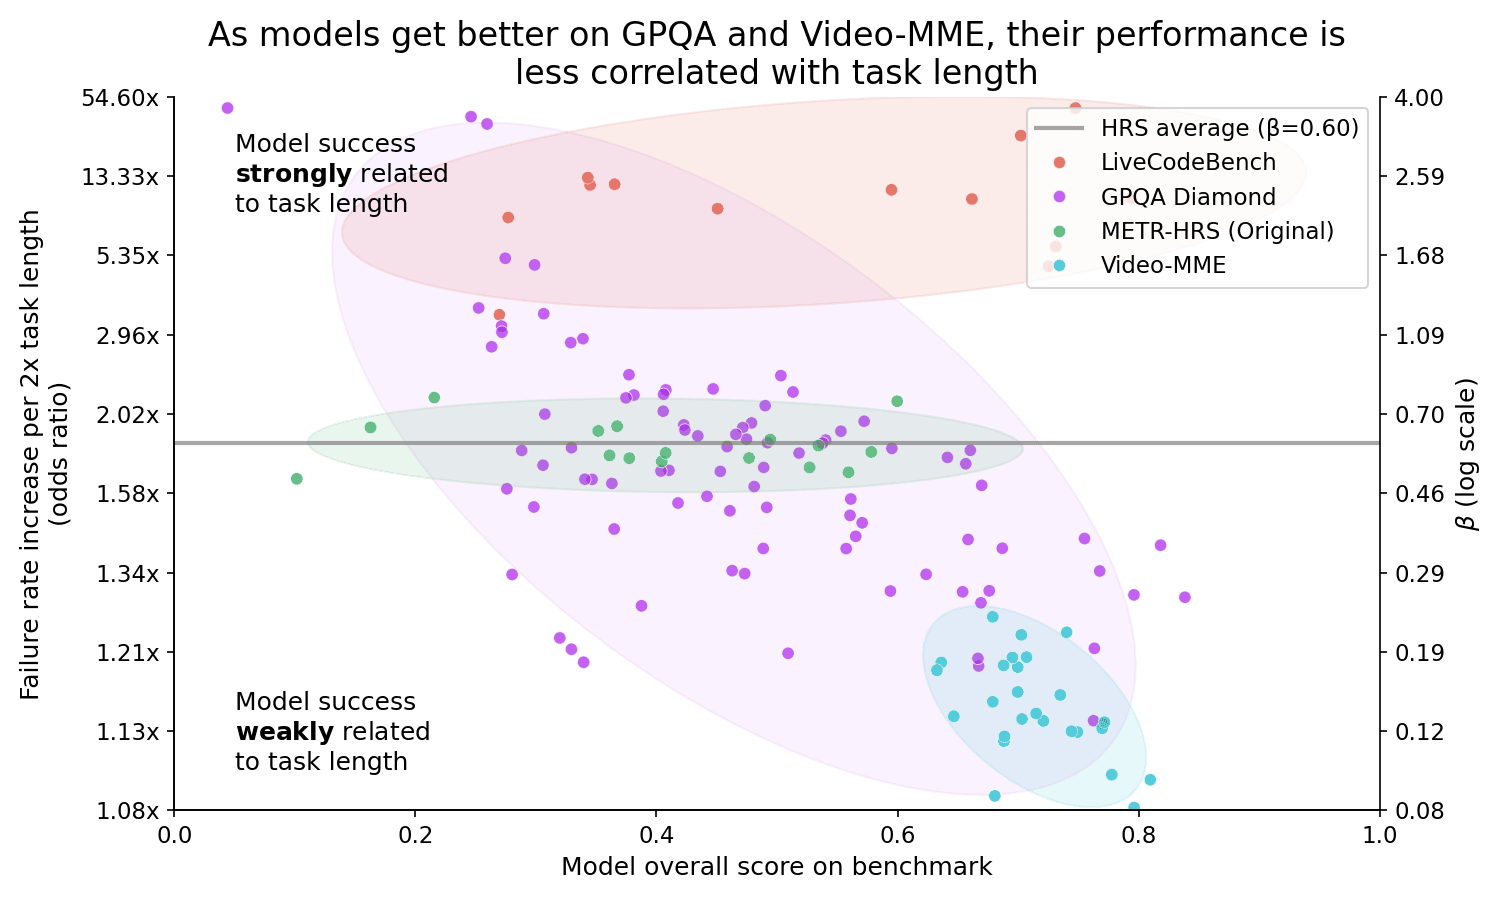
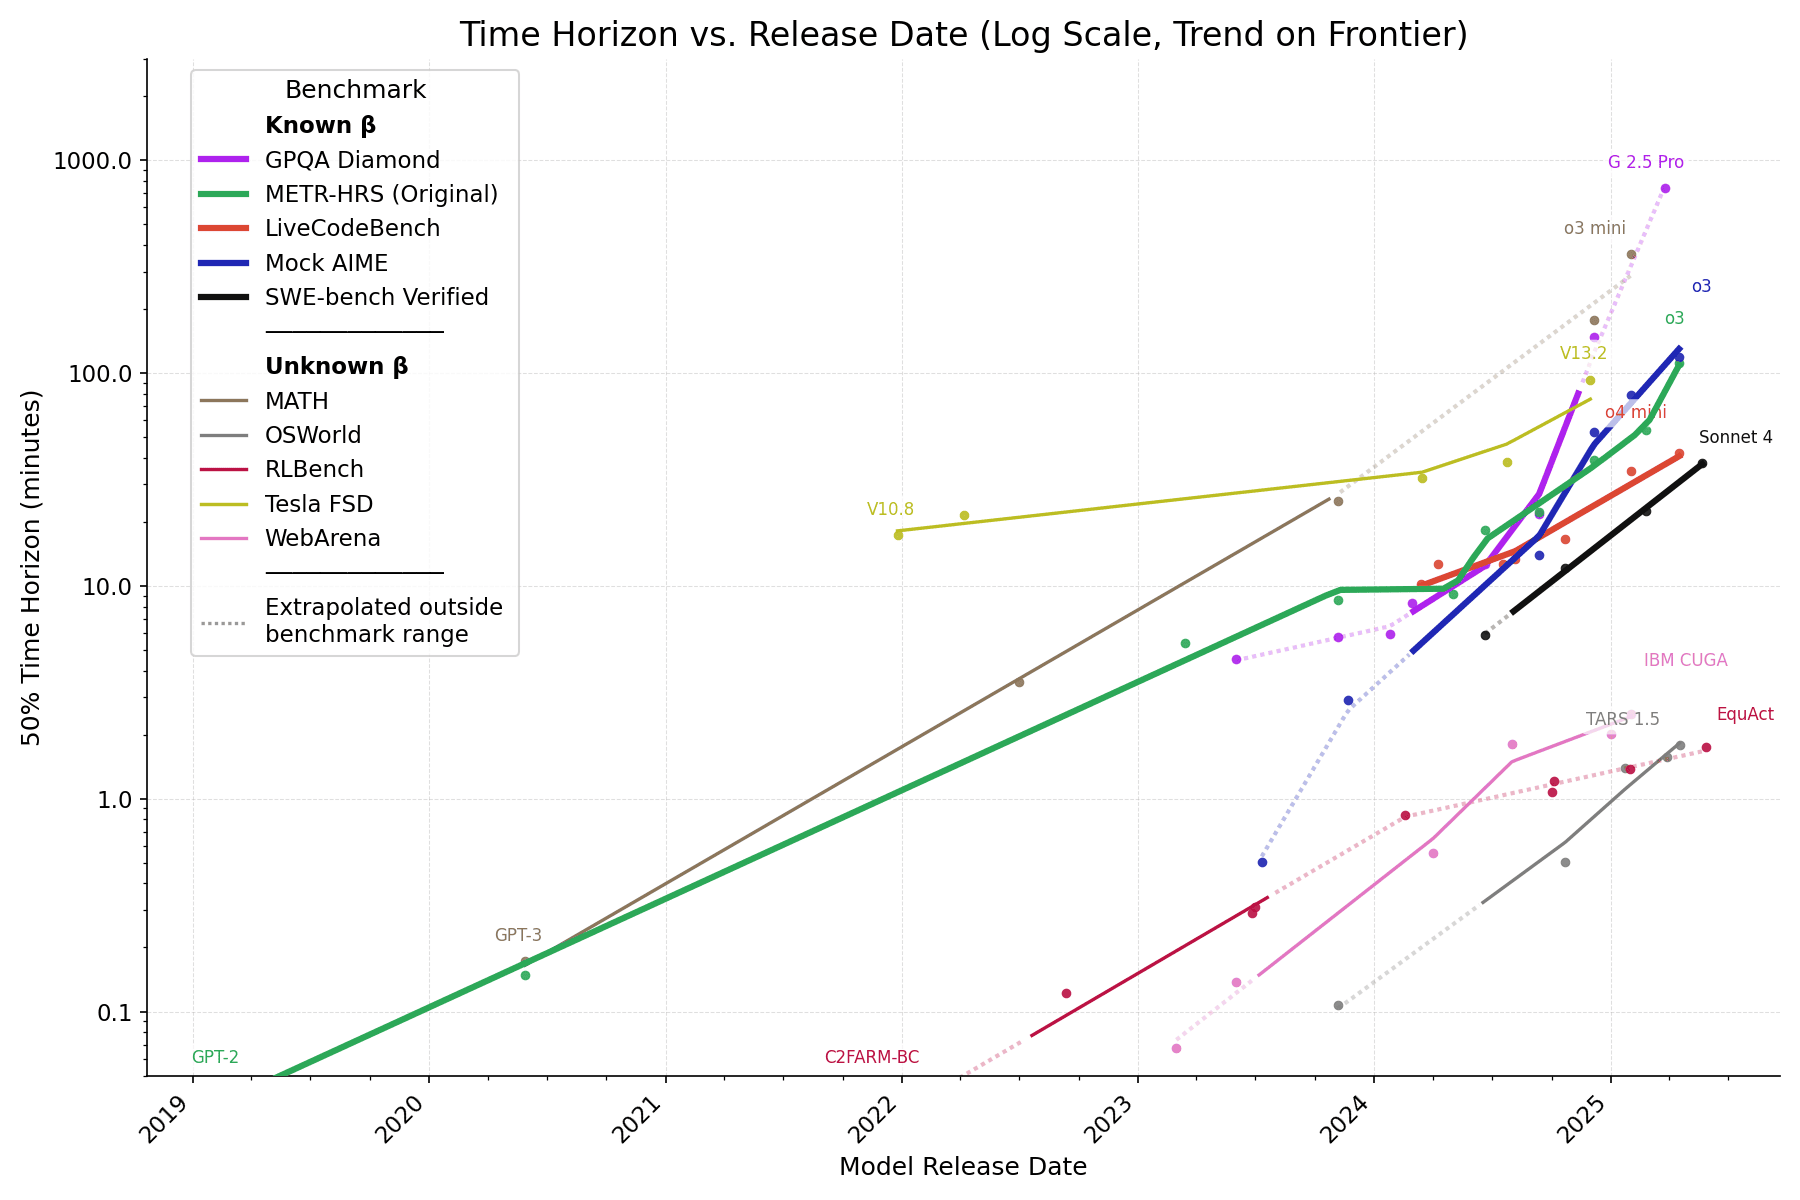
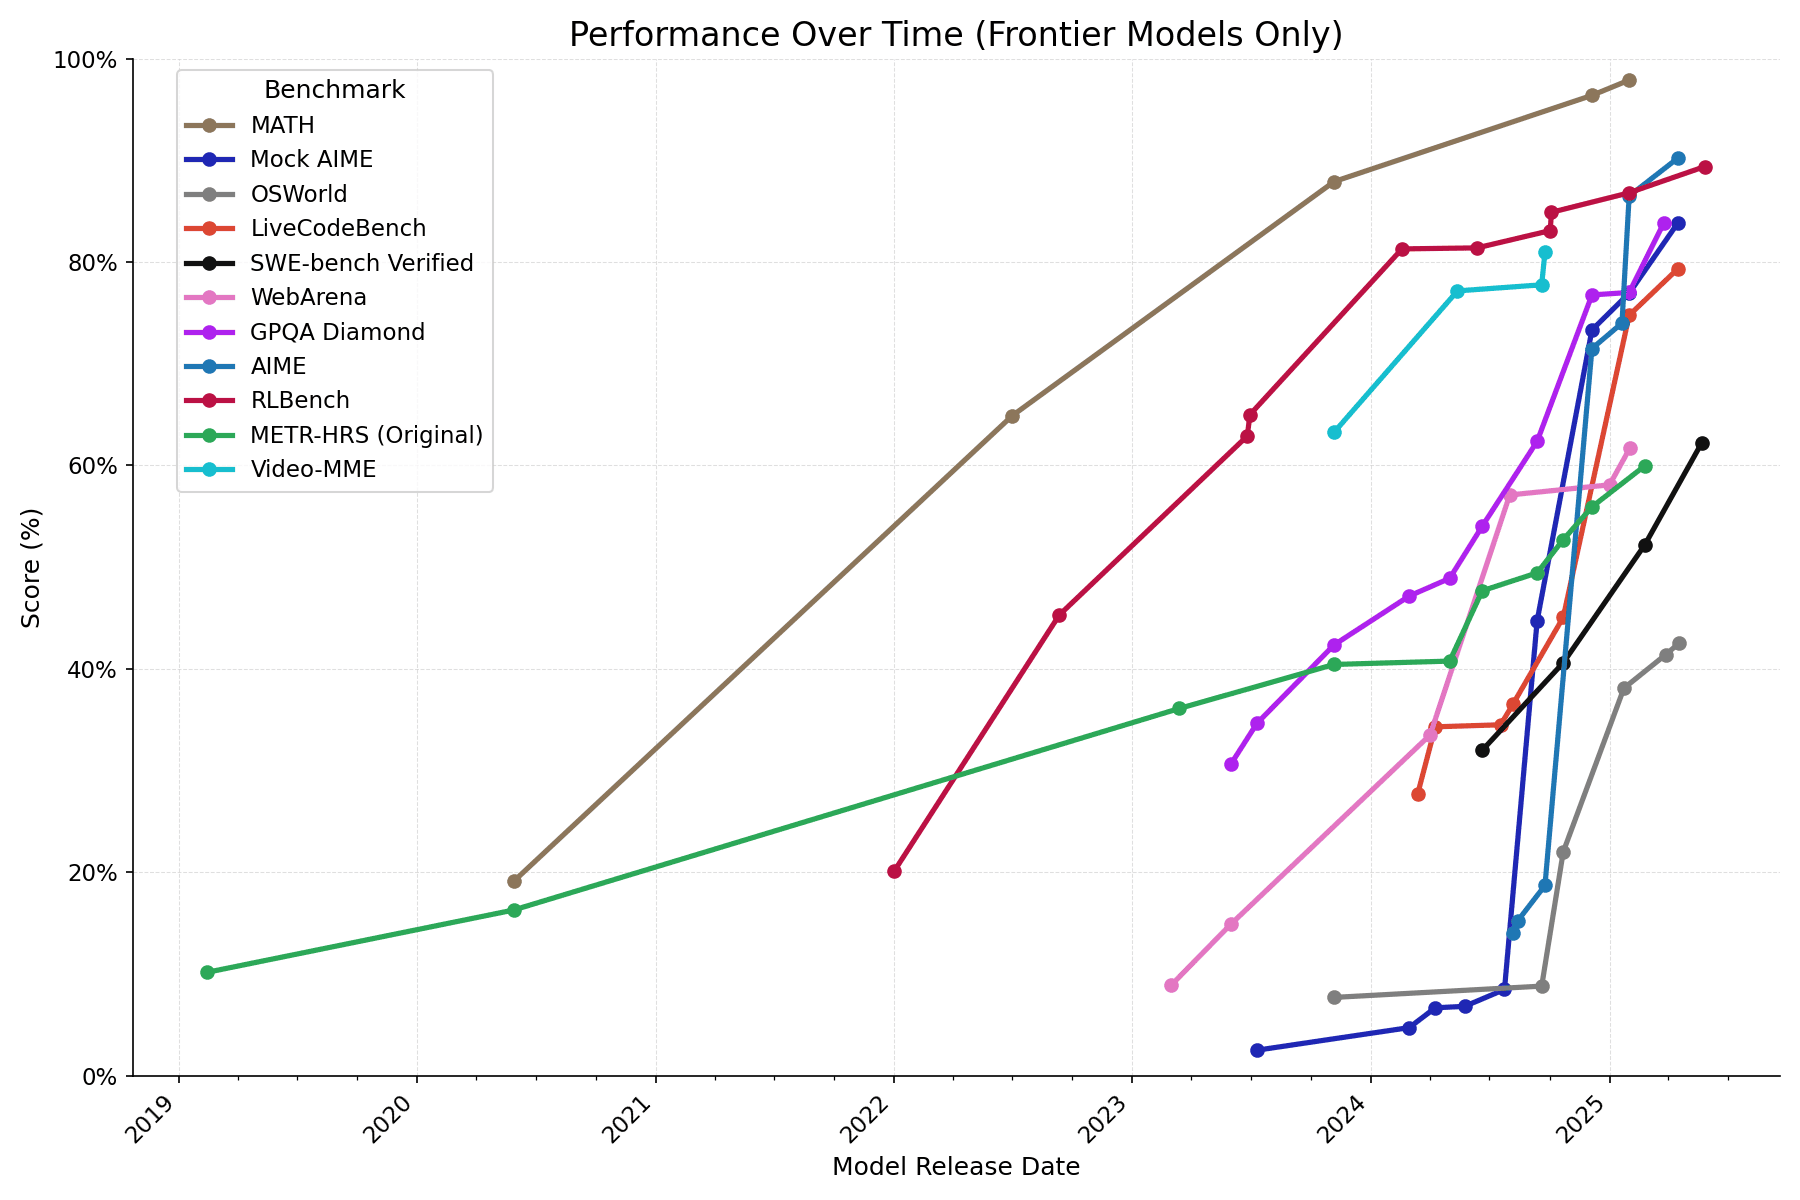
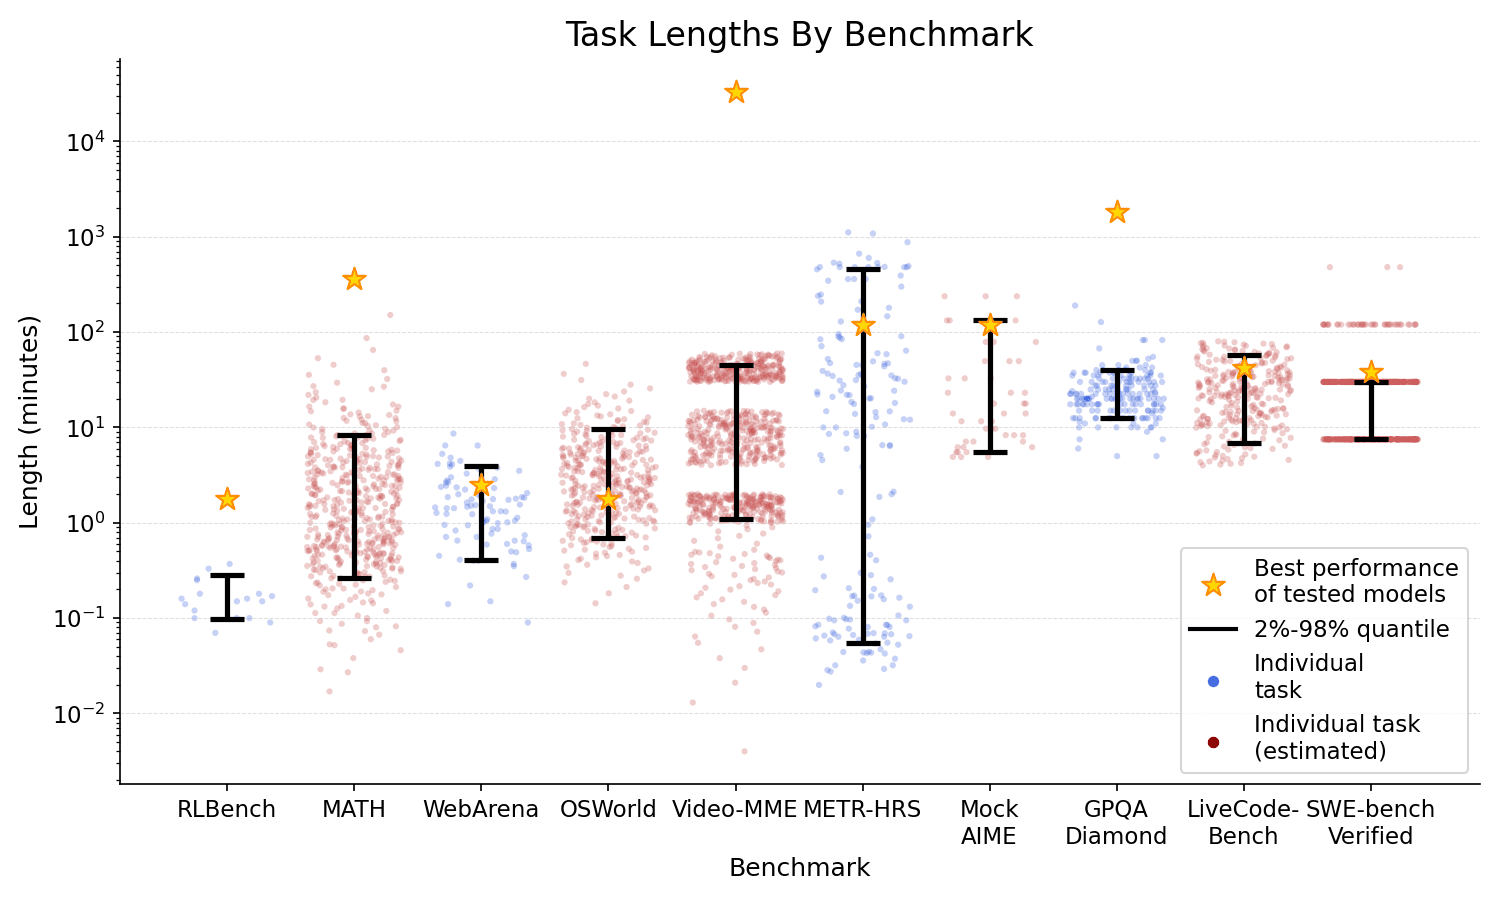
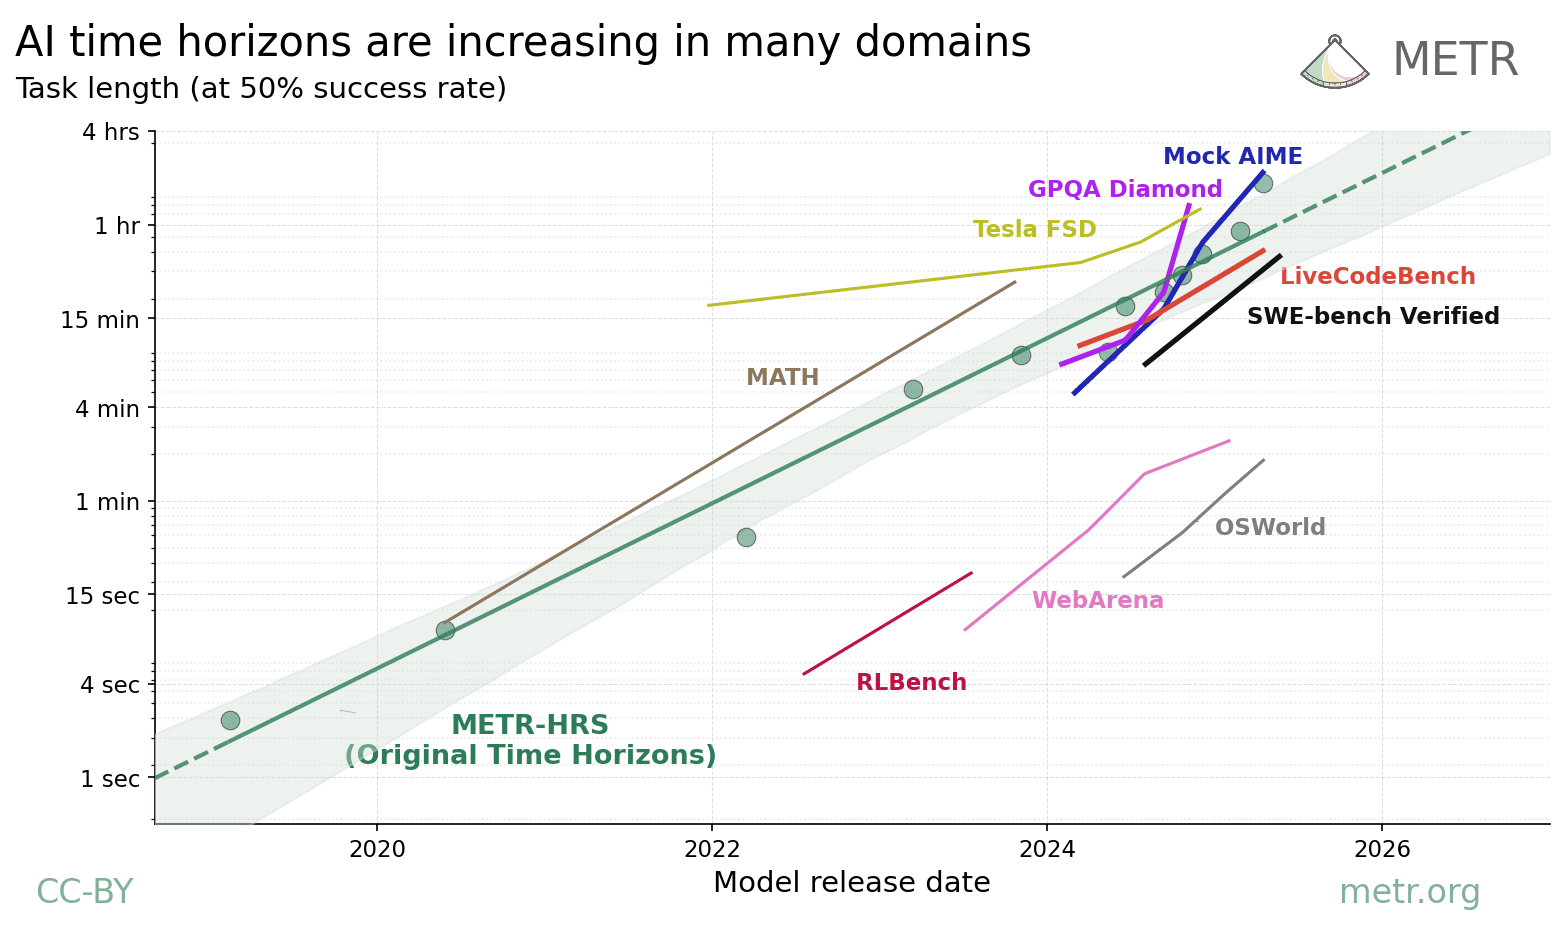
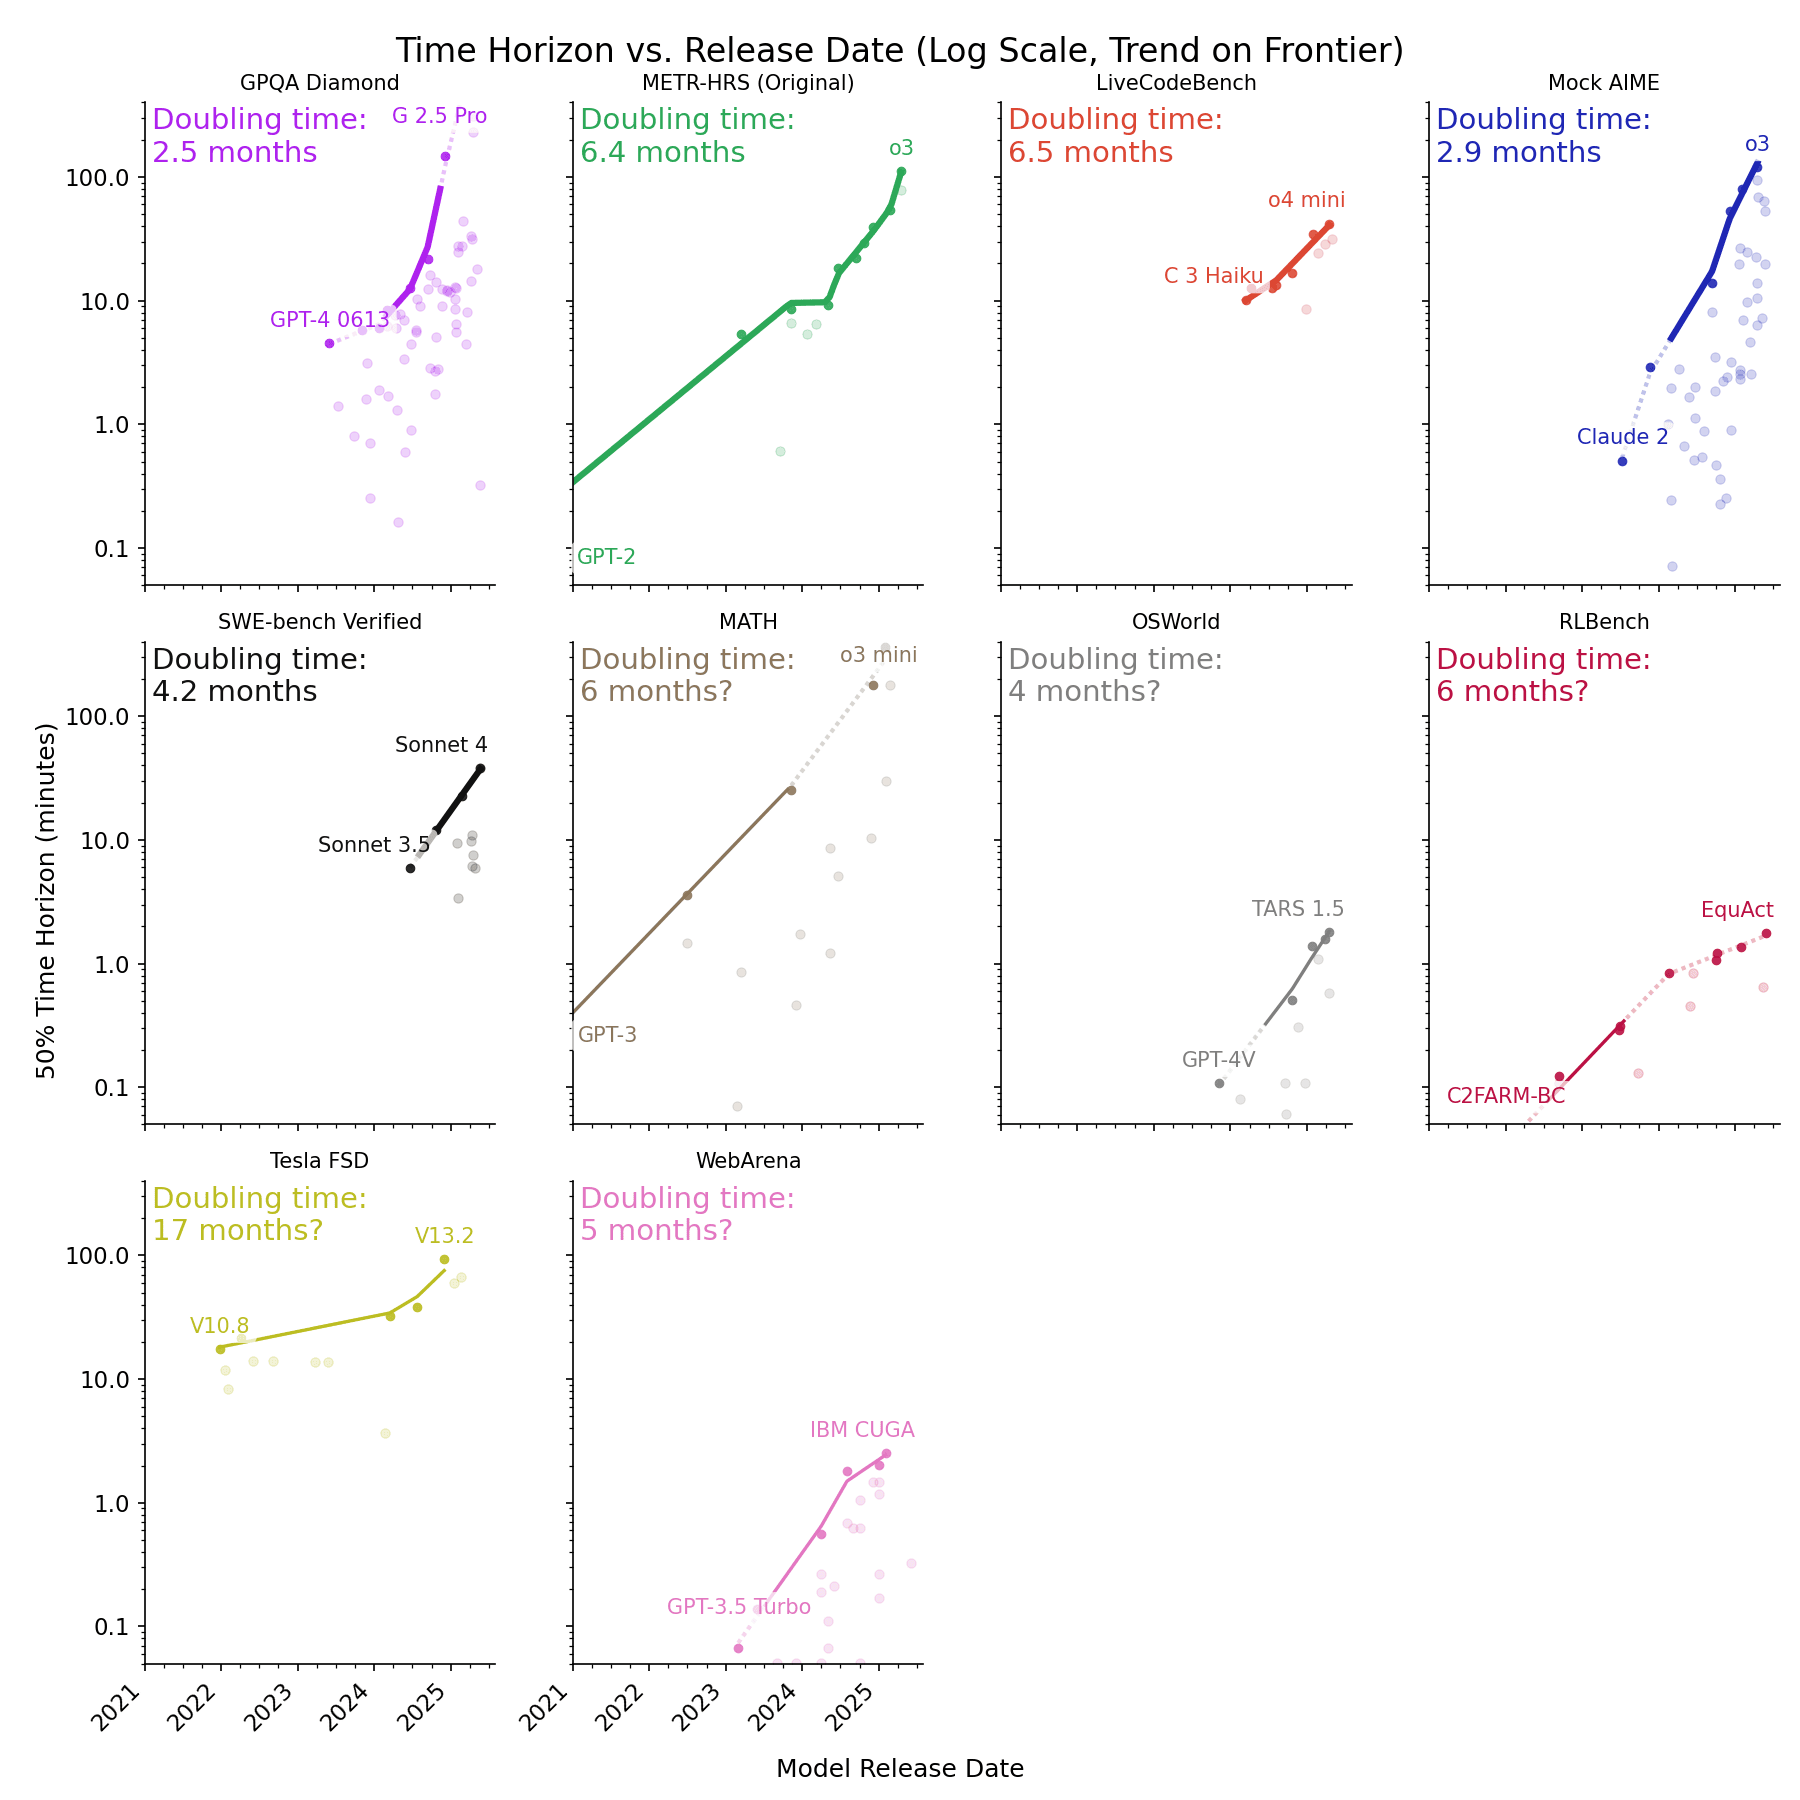
In the paper Measuring AI Ability to Complete Long Software Tasks (Kwa & West et al. 2025), METR defined an AI model's 50% time horizon as the length of tasks (measured by how long they take human professionals) that it can complete autonomously with 50% probability. We estimated the time horizon of frontier models released since 2019 on a benchmark combining three sets of software and research tasks ranging from 1 second to 16 hours in length-for-humans (HCAST, RE-Bench, and SWAA, henceforth METR-HRS). METR found that the time horizon has doubled every 7 months, possibly accelerating to every 4 months in 2024.
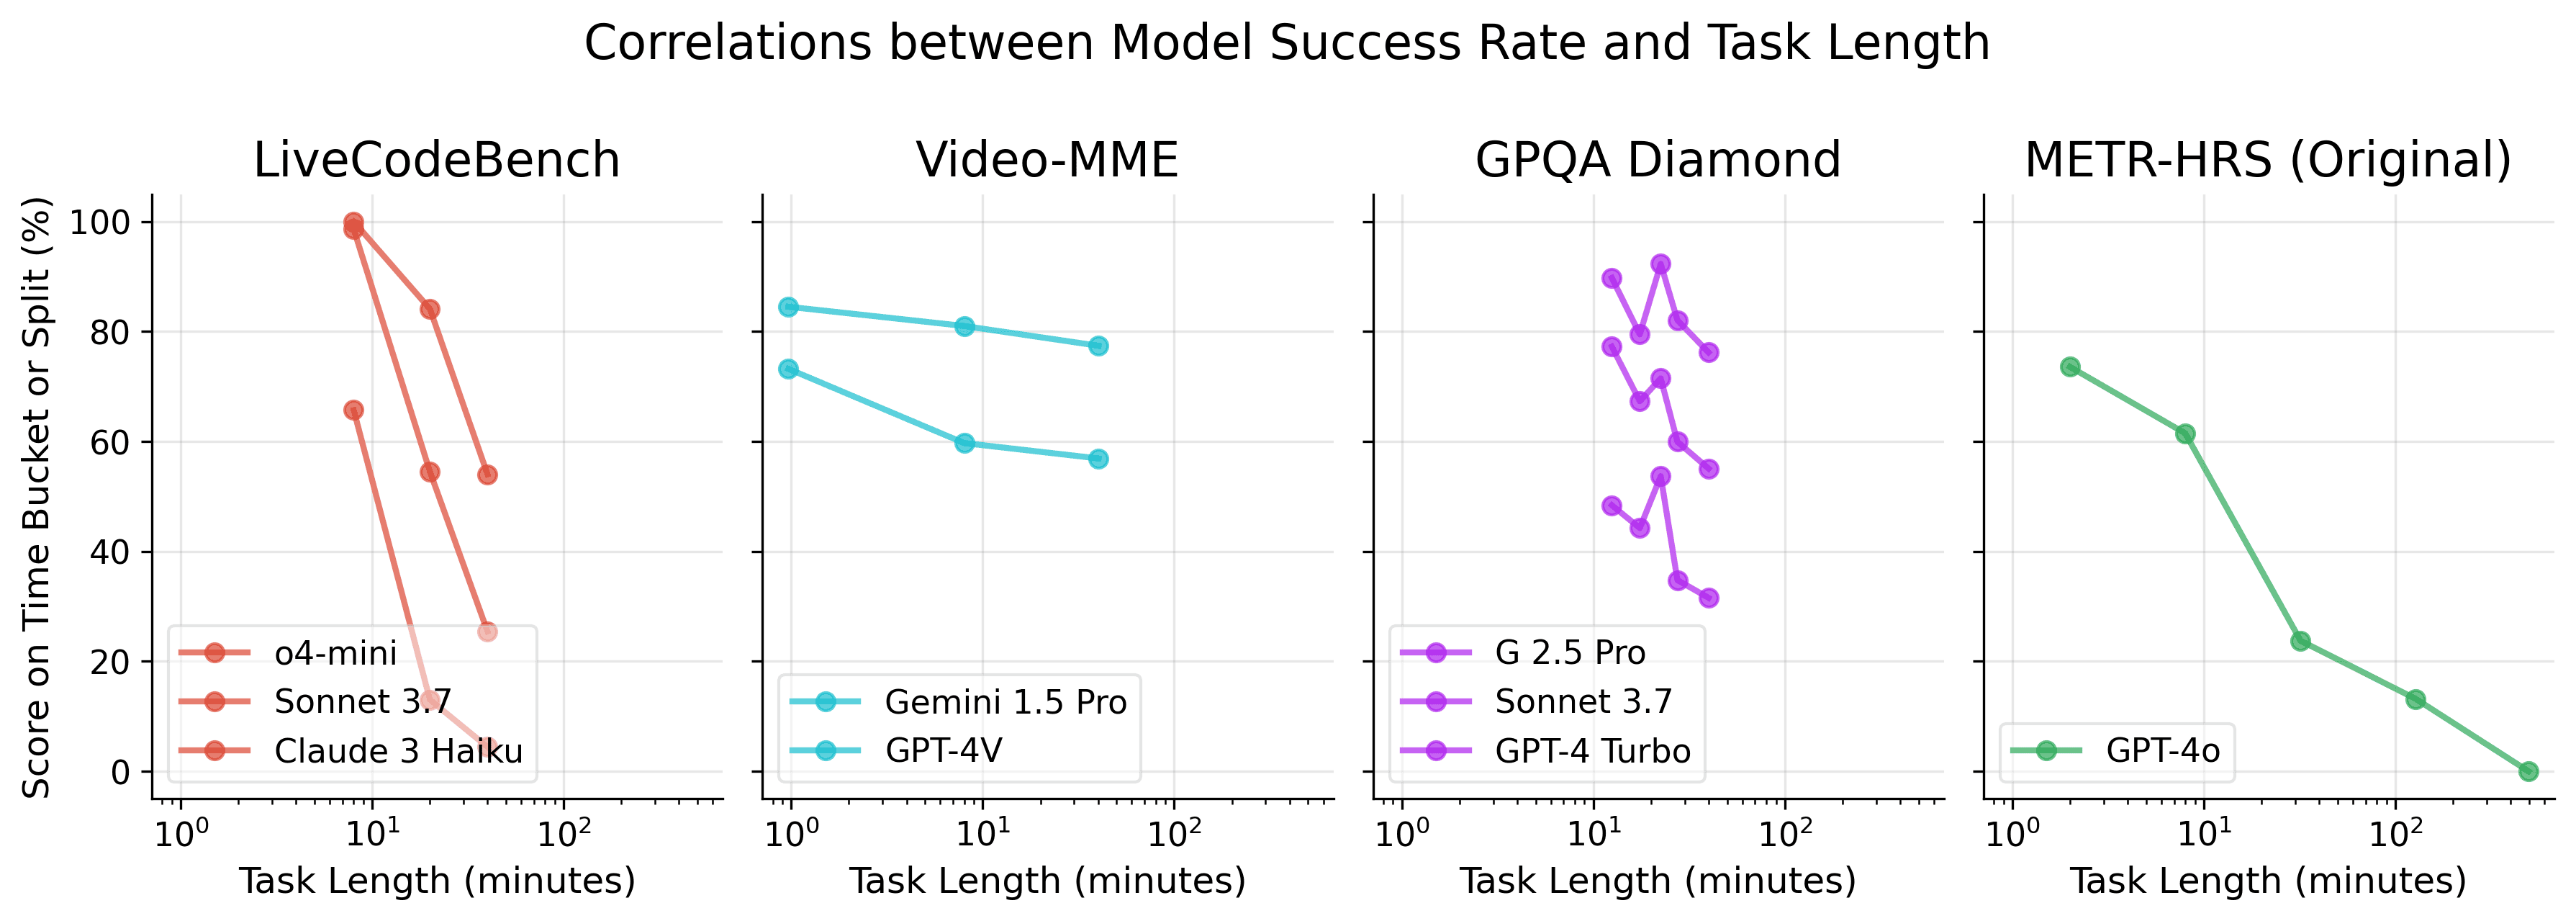
One important limitation was the task domain: all involved software engineering or research, but AI capabilities are known to vary greatly between different task types.[1] Here we explore whether similar trends apply to different task distributions including self-driving and agentic computer use, using a methodology that [...]
---
Outline:
(00:10) Summary
(03:48) Methodology
(07:31) Benchmarks
(08:58) Results
(09:01) Trends on other domains
(09:58) Main takeaway
(10:27) More observations
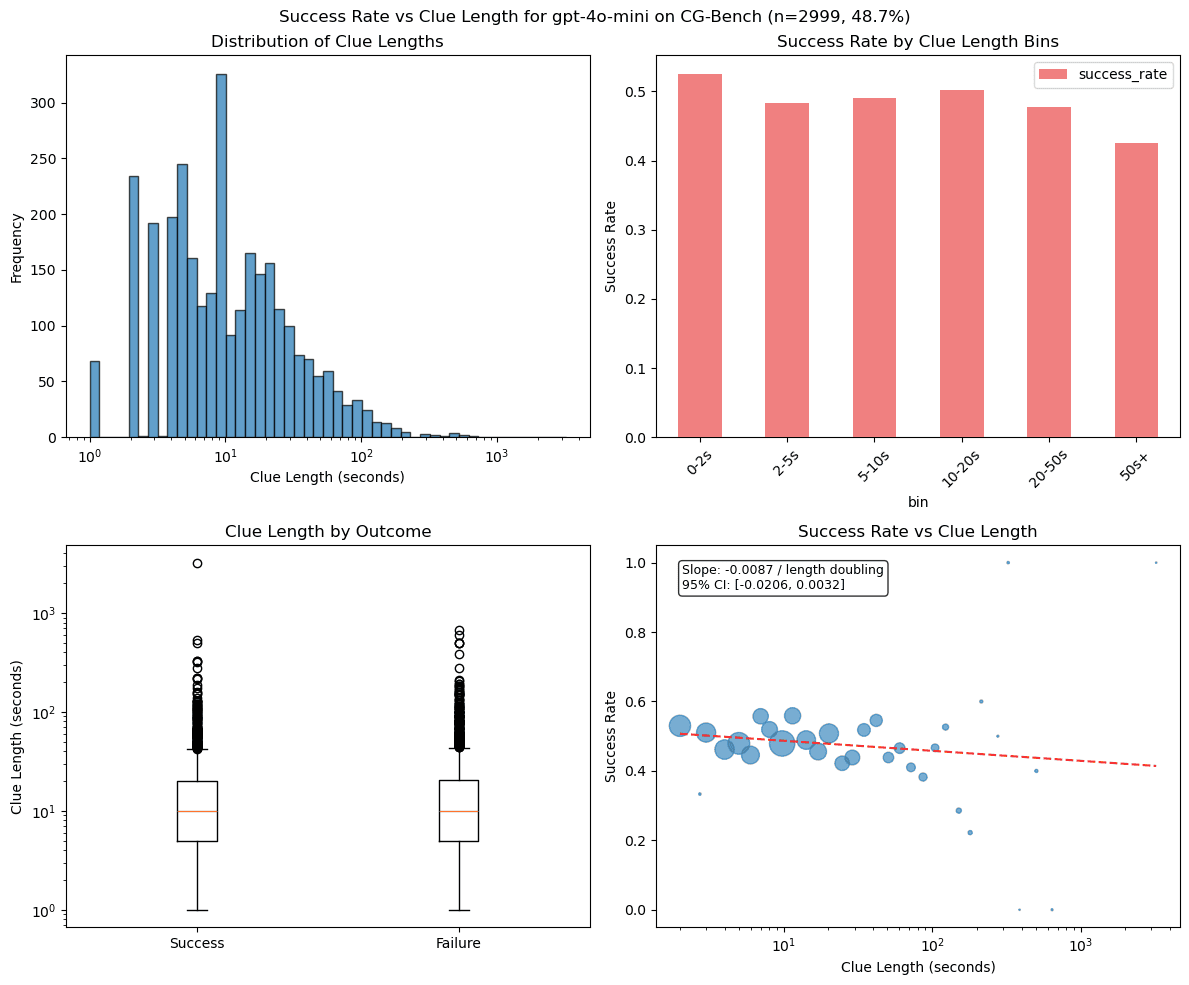
(13:23) Soundness of the time horizon metric
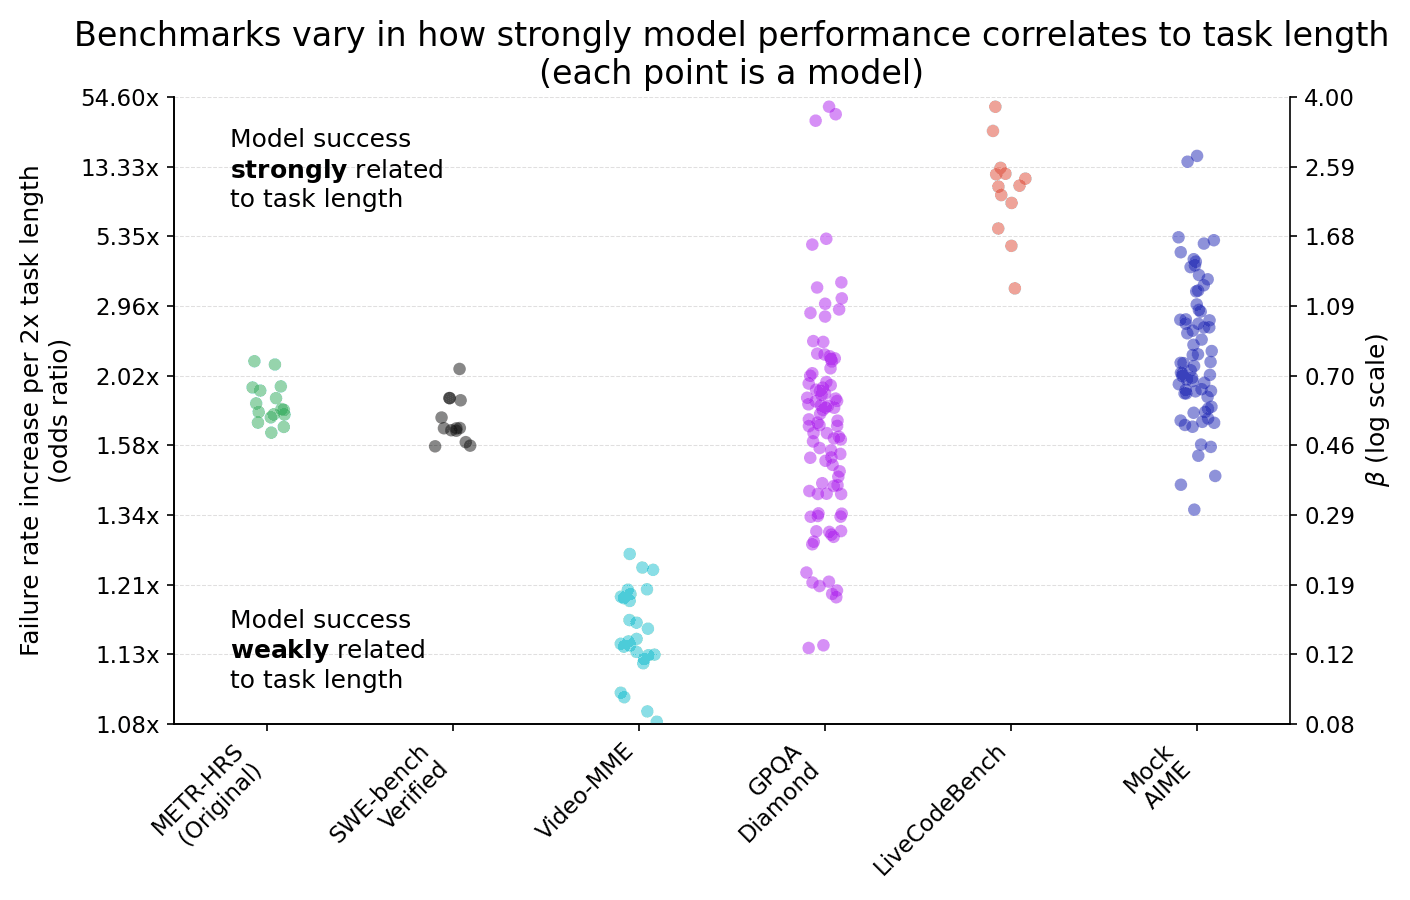
(18:22) Video length is a poor predictor of difficulty
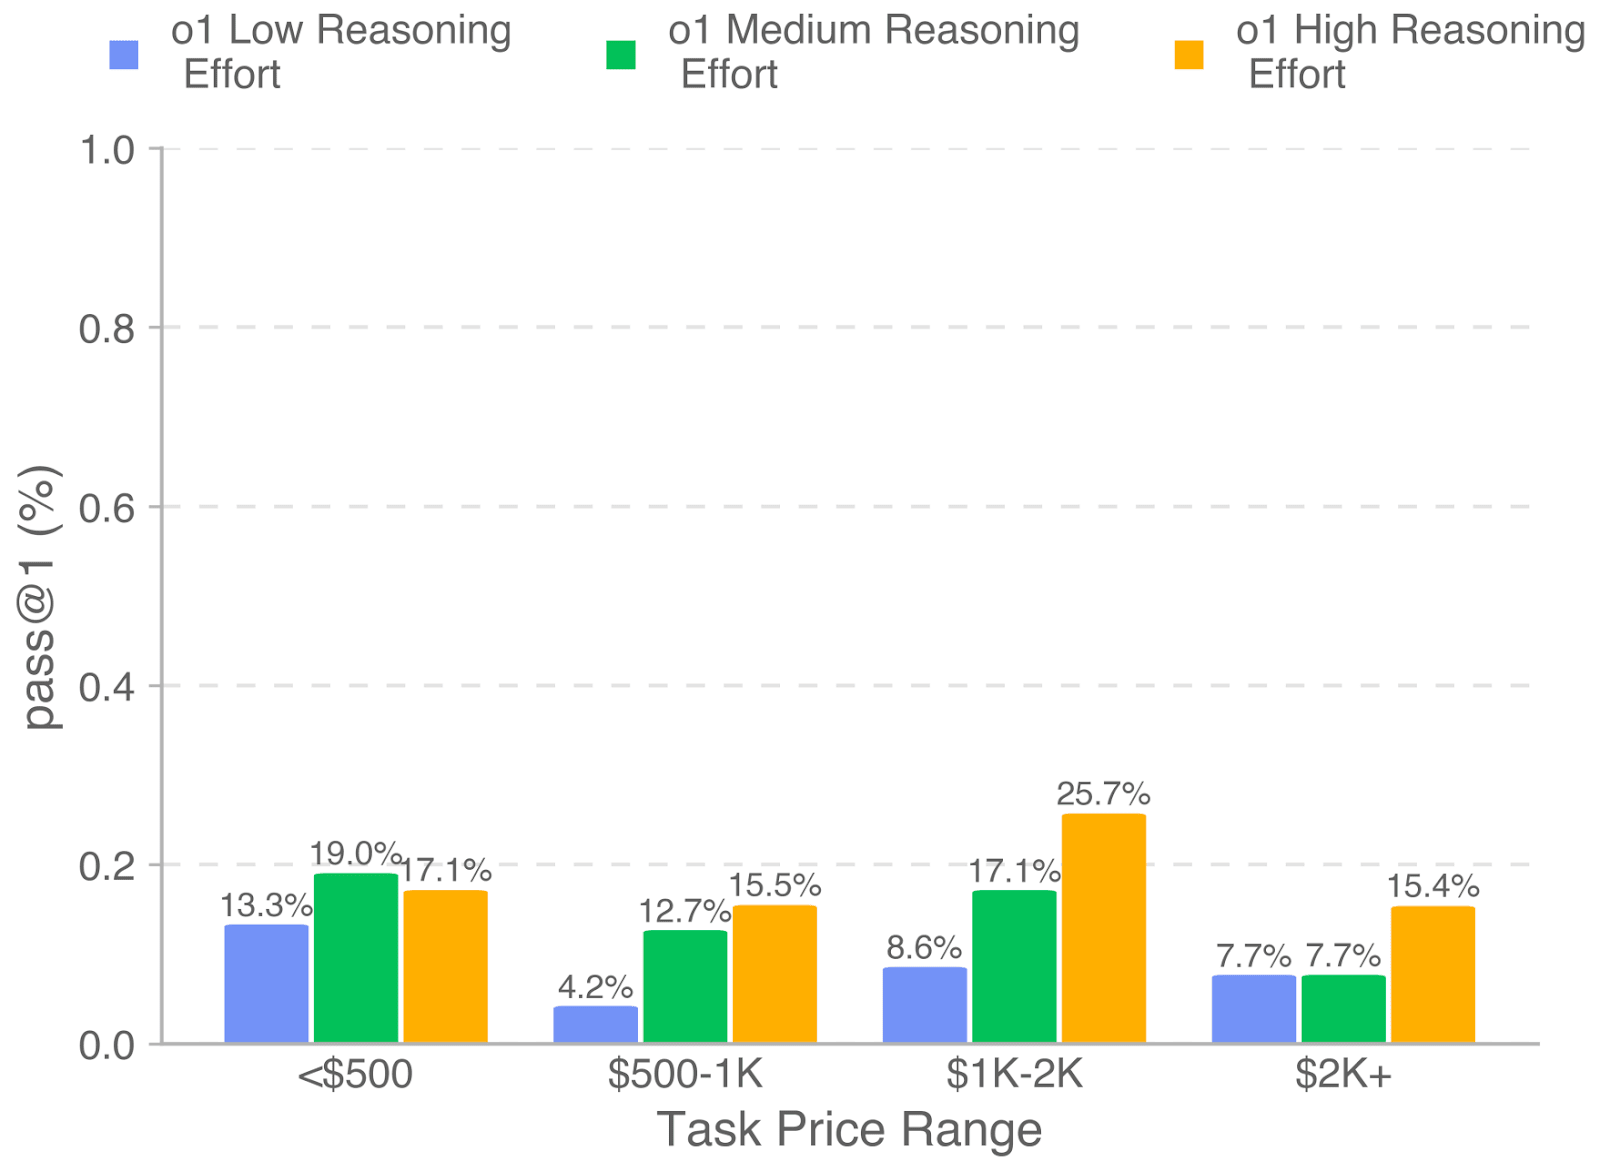
(21:16) SWE-Lancer task value is a poor predictor of difficulty
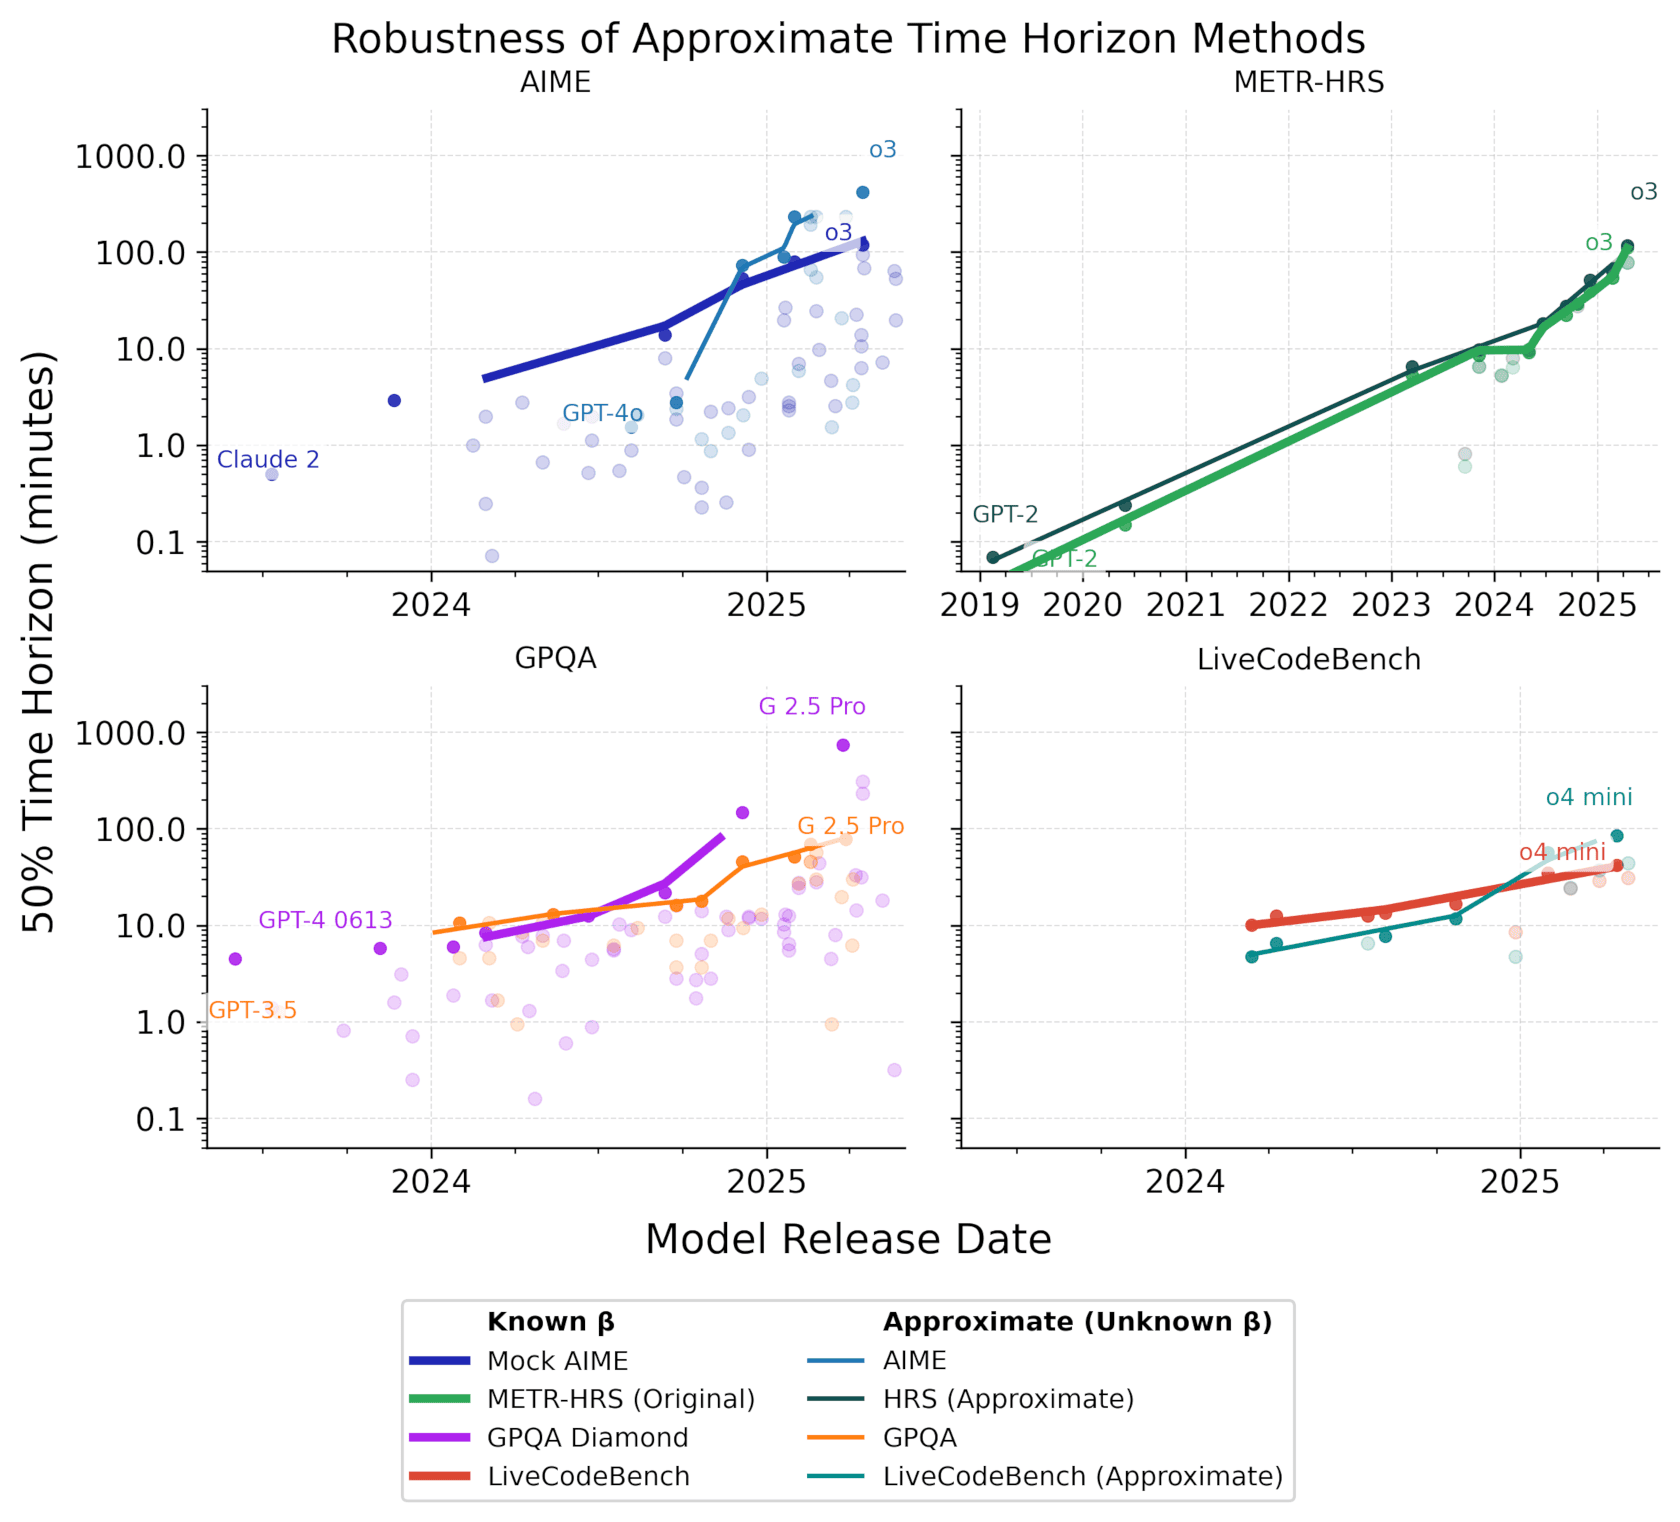
(22:25) Robustness checks
(24:23) Limitations and future work
(27:22) Conclusion
(28:50) Appendix
(28:53) Potential future experiments
(30:06) Details for individual benchmarks
(35:48) Other plots
(35:52) Raw data
---
First published:
July 14th, 2025
Source:
https://www.lesswrong.com/posts/6KcP7tEe5hgvHbrSF/how-does-time-horizon-vary-across-domains
---
Narrated by TYPE III AUDIO.
---
Images from the article:
Apple Podcasts and Spotify do not show images in the episode description. Try Pocket Casts, or another podcast app.
Senaste avsnitt
En liten tjänst av I'm With Friends. Finns även på engelska.