
Throughout the first half of 2025 I did a blinded experiment to see how low to moderate melatonin intake affects me. In this post I summarize my findings.
Tl;dr: In my blinded self-experiment on melatonin, conducted over n = 60 days and analyzed with hypothesize.io, I found significantly positive effects for time to fall asleep (averaging ~25 instead of ~35 minutes, p ~= 0.001) and feeling awake the following morning (5.74/10 instead of 4.95/10, p = 0.006; but: this effect only persisted for the lower of two dosages, and did not persist throughout the rest of the day; could well be a false positive, as I didn’t correct for multiple hypothesis testing) for a dosage as low as 0.15mg of melatonin, taken on average ~1h before going to bed.
Feel free to jump ahead to the Results section if you don't care much about my methodology.
Experiment Setup
I [...]
---
Outline:
(01:14) Experiment Setup
(04:51) Hypotheses
(05:43) Results
(07:15) Limitations
(09:26) Detailed Results
(09:30) Sleep Quality
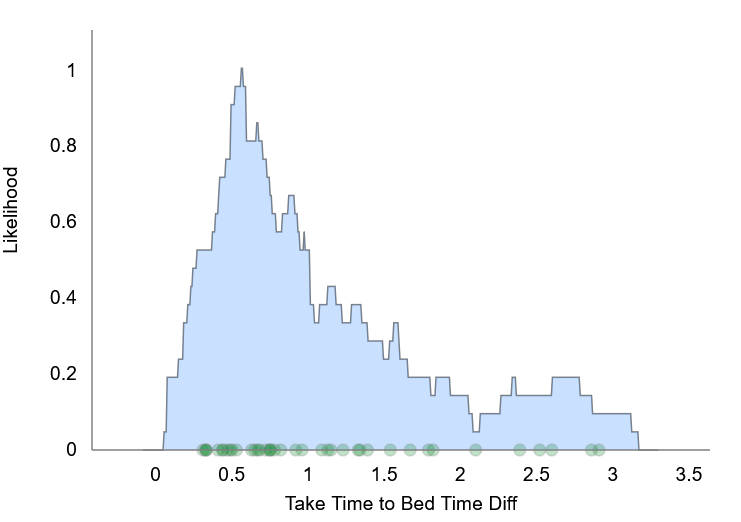
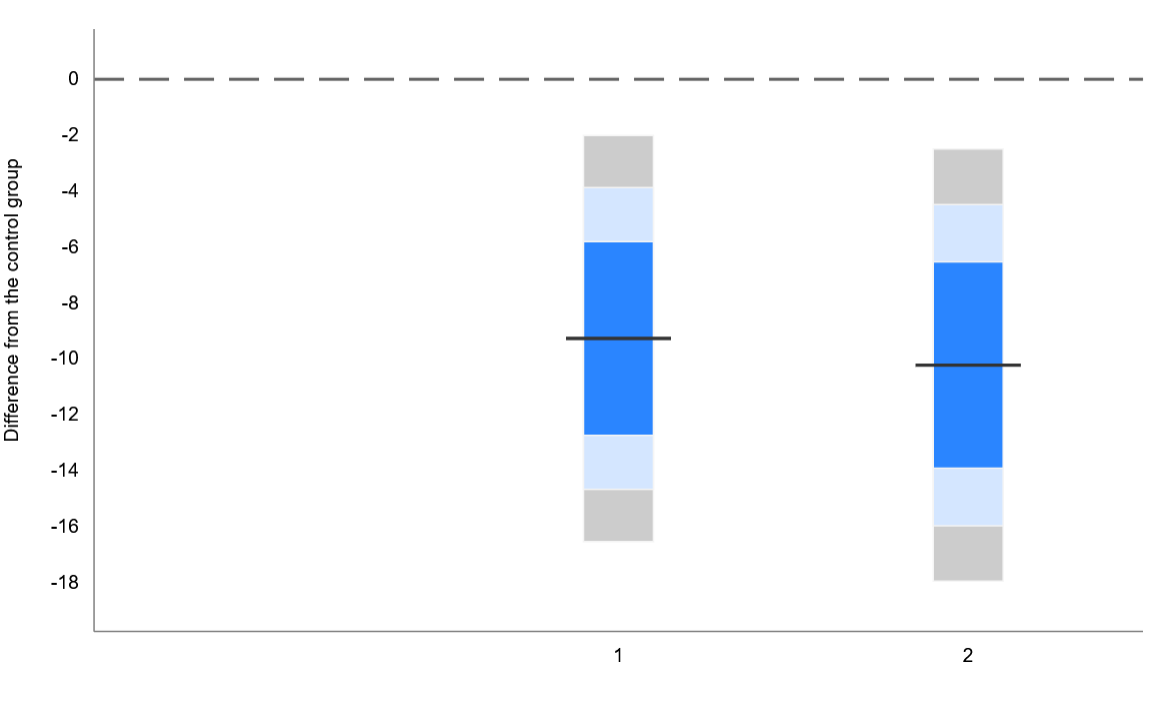
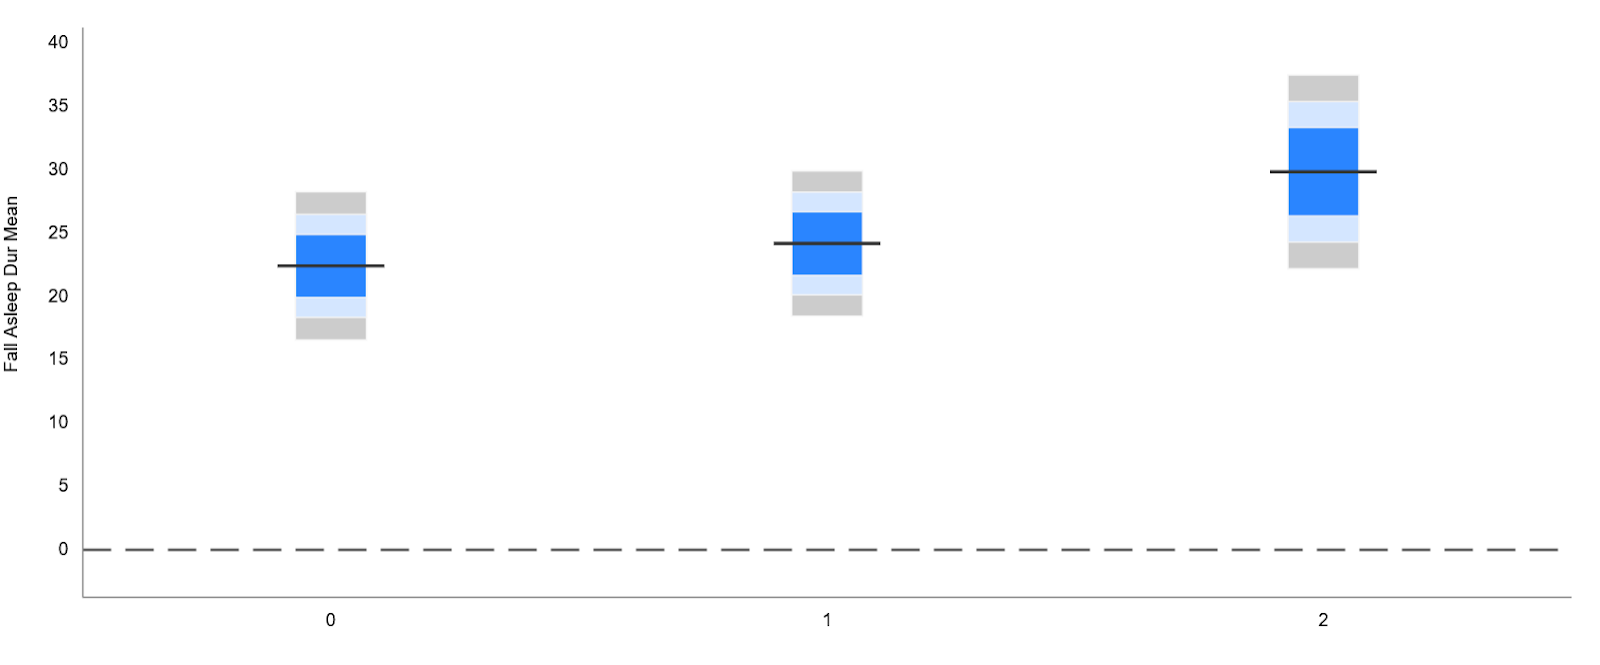
(10:41) Fall Asleep Duration
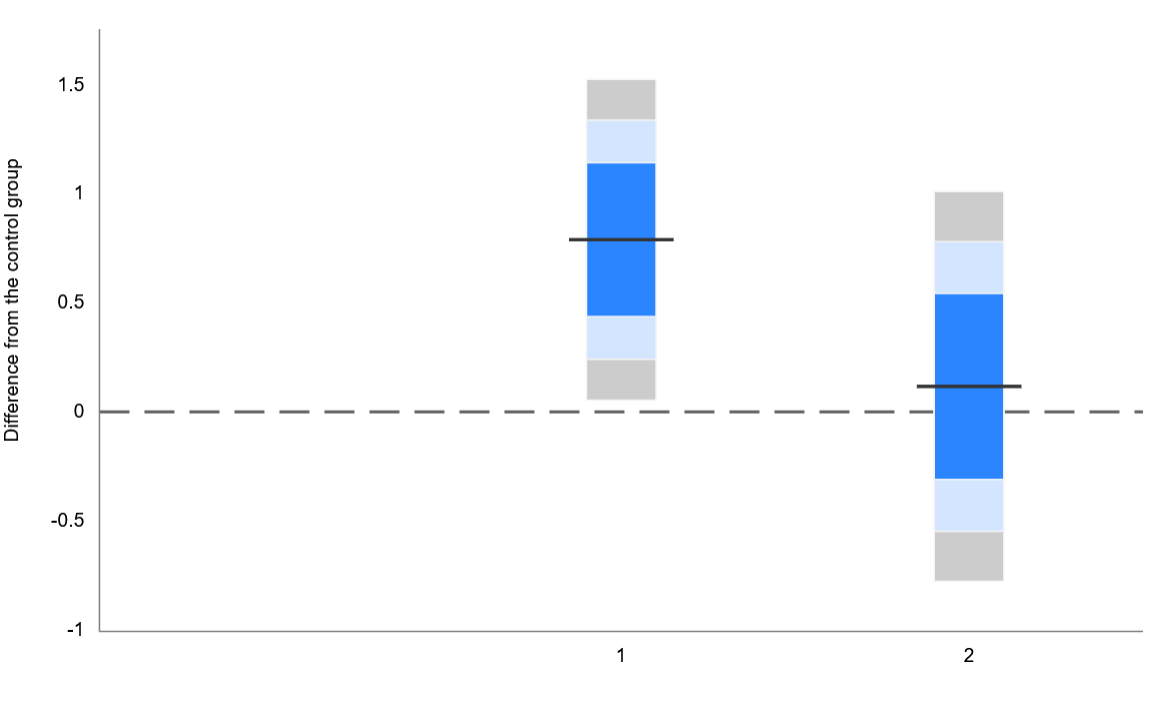
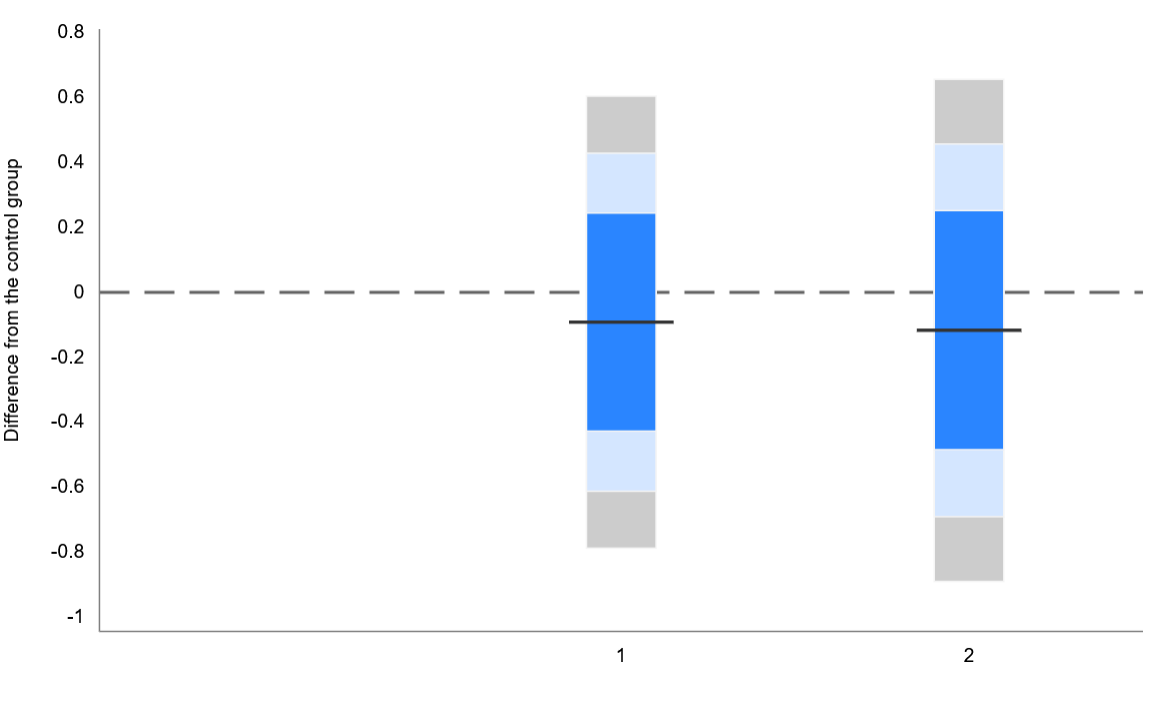
(11:46) Wakefulness after Waking Up
(12:55) Wakefulness at Noon
(13:36) Wakefulness at 4pm
(14:14) Wake-Up Time
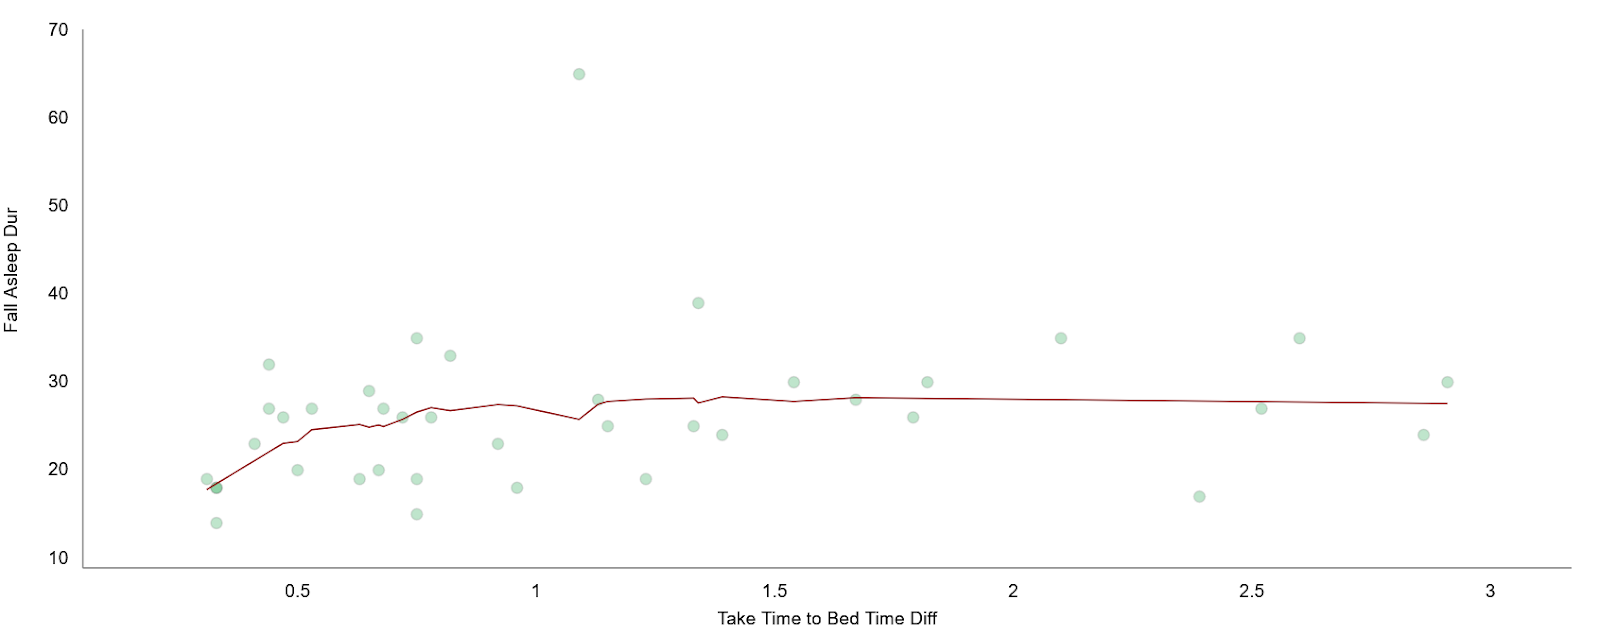
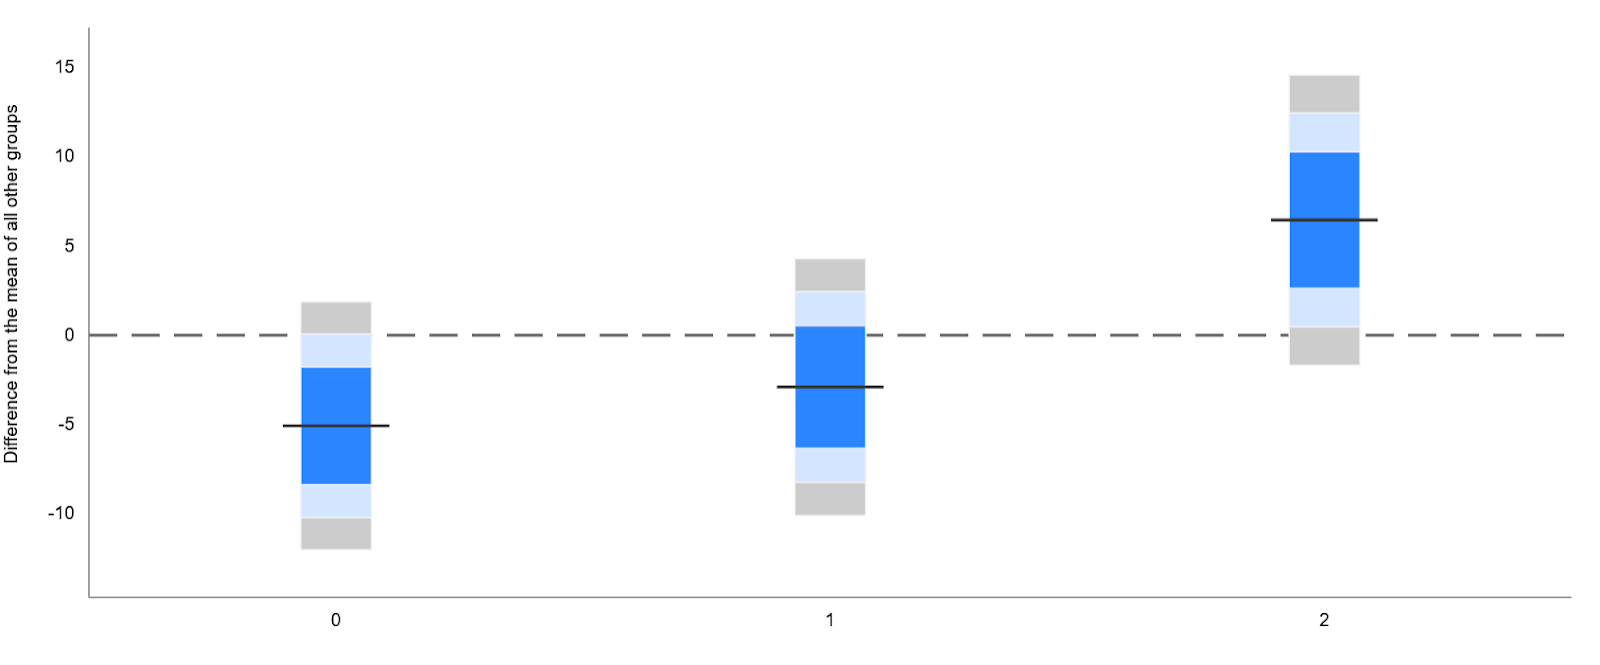
(15:27) When Best to Take Melatonin
(18:29) Learnings for Future Self-Experiments
The original text contained 1 footnote which was omitted from this narration.
---
First published:
June 25th, 2025
Source:
https://www.lesswrong.com/posts/mHEMgNHYADjpzEizk/melatonin-self-experiment-results
---
Narrated by TYPE III AUDIO.
---
Images from the article:
Apple Podcasts and Spotify do not show images in the episode description. Try Pocket Casts, or another podcast app.
Senaste avsnitt
En liten tjänst av I'm With Friends. Finns även på engelska.