
“Summary of John Halstead’s Book-Length Report on Existential Risks From Climate Change” by Bentham’s Bulldog
1 Introduction
(Crossposted from my blog--formatting is better there).
Very large numbers of people seem to think that climate change is likely to end the world. Biden and Harris both called it an existential threat. AOC warned a few years ago that “the world is going to end in 12 years if we don’t address climate change.” Thunberg once approvingly cited a supposed “top climate scientist” making the claim that “climate change will wipe out humanity unless we stop using fossil fuels over the next five years.” Around half of Americans think that climate change will destroy the planet (though despite this, most don’t consider it a top political issue, which means that a sizeable portion of the population thinks climate change will destroy the planet, but doesn’t think that means we should prioritize it over taxes and healthcare).
I was taught by my science teacher in ninth [...]
---
Outline:
(00:13) 1 Introduction
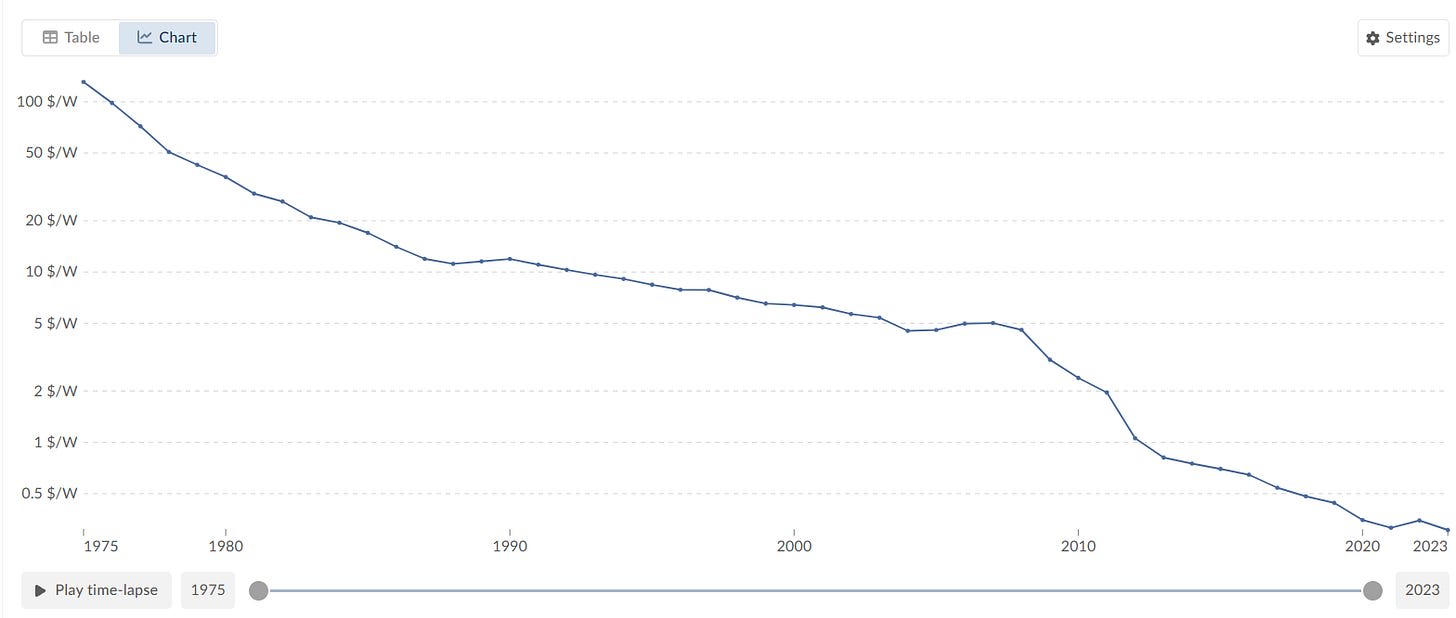
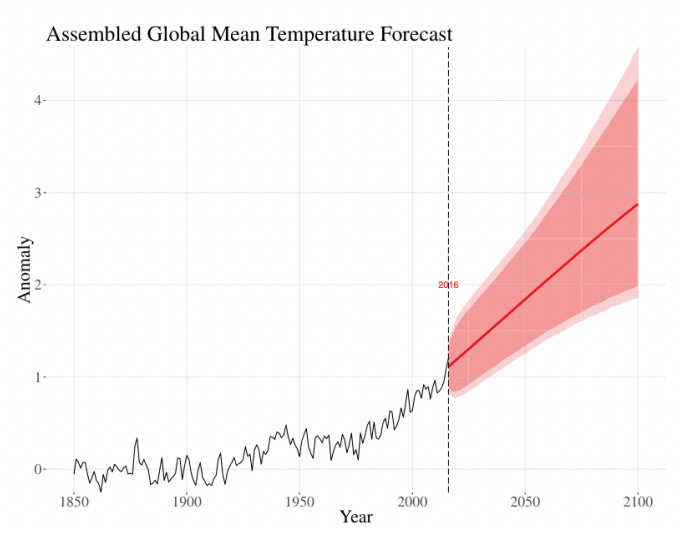
(04:36) 2 How much warming will there be?
(07:33) 3 How past warming periods have gone
(11:25) 4 Agriculture
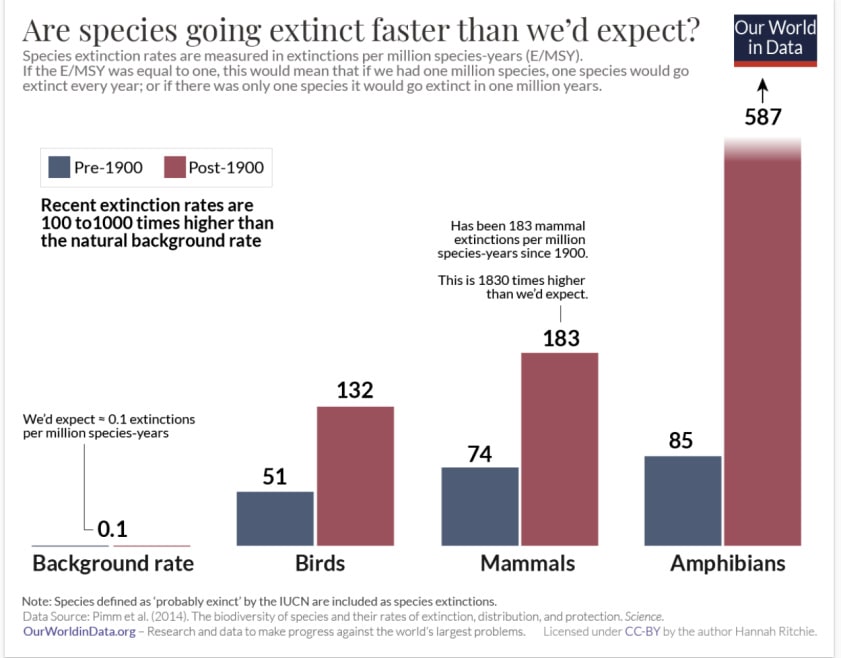
(14:42) 5 Ecosystem collapse and threats to agriculture
(20:57) 6 Heat stress and sea level rise
(22:51) 7 Tipping points
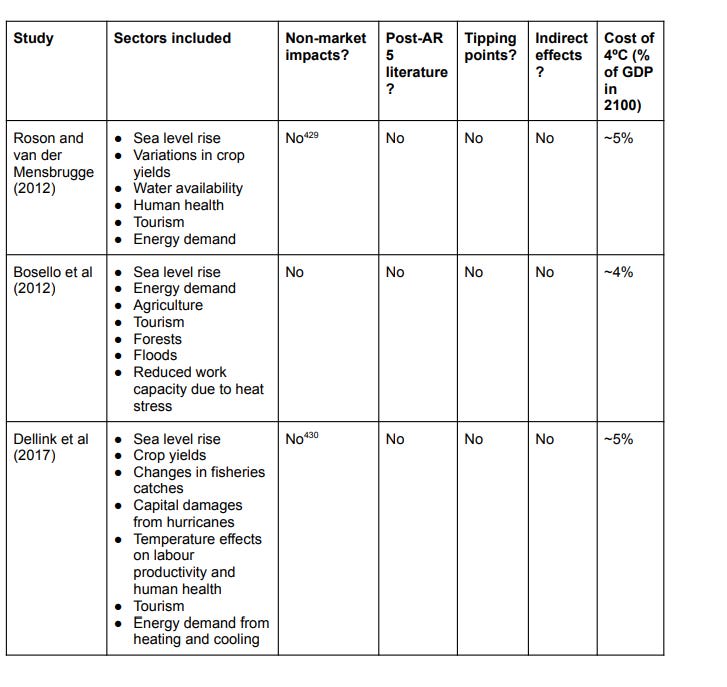
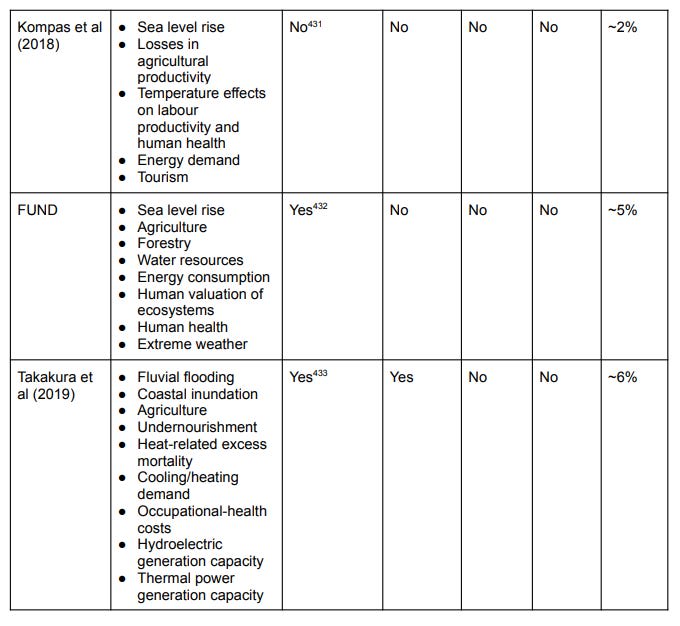
(28:25) 8 Economic costs
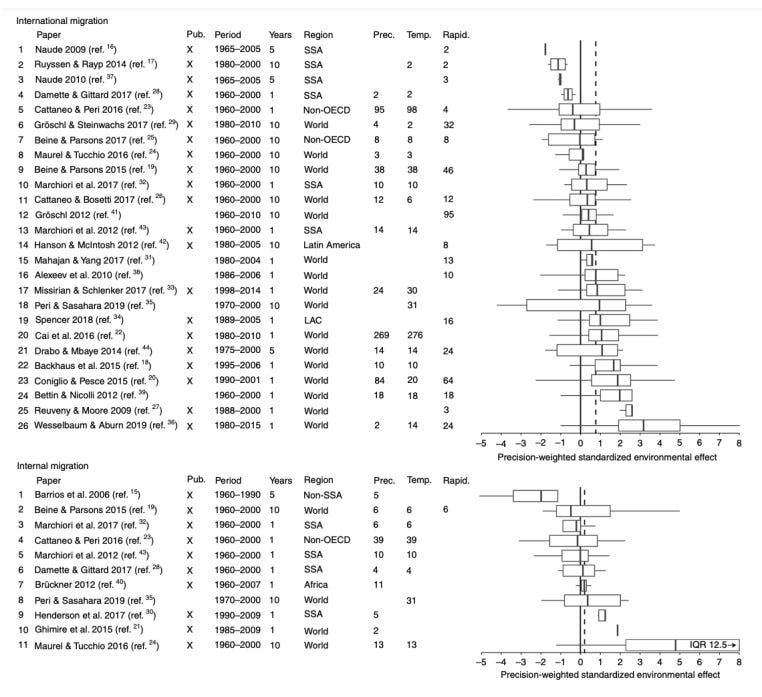
(31:06) 9 Migration
(33:42) 10 Conflict
(40:01) 11 Conclusion
---
First published:
June 25th, 2025
---
Narrated by TYPE III AUDIO.
---
Images from the article:


Apple Podcasts and Spotify do not show images in the episode description. Try Pocket Casts, or another podcast app.
Senaste avsnitt
En liten tjänst av I'm With Friends. Finns även på engelska.