Sveriges mest populära poddar

LessWrong (30+ Karma)

“Towards data-centric interpretability with sparse autoencoders” by Nick Jiang, lilysun004, lewis smith, Neel Nanda

36 min • 16 augusti 2025

Nick and Lily are co-first authors on this project. Lewis and Neel jointly supervised this project.

TL;DR

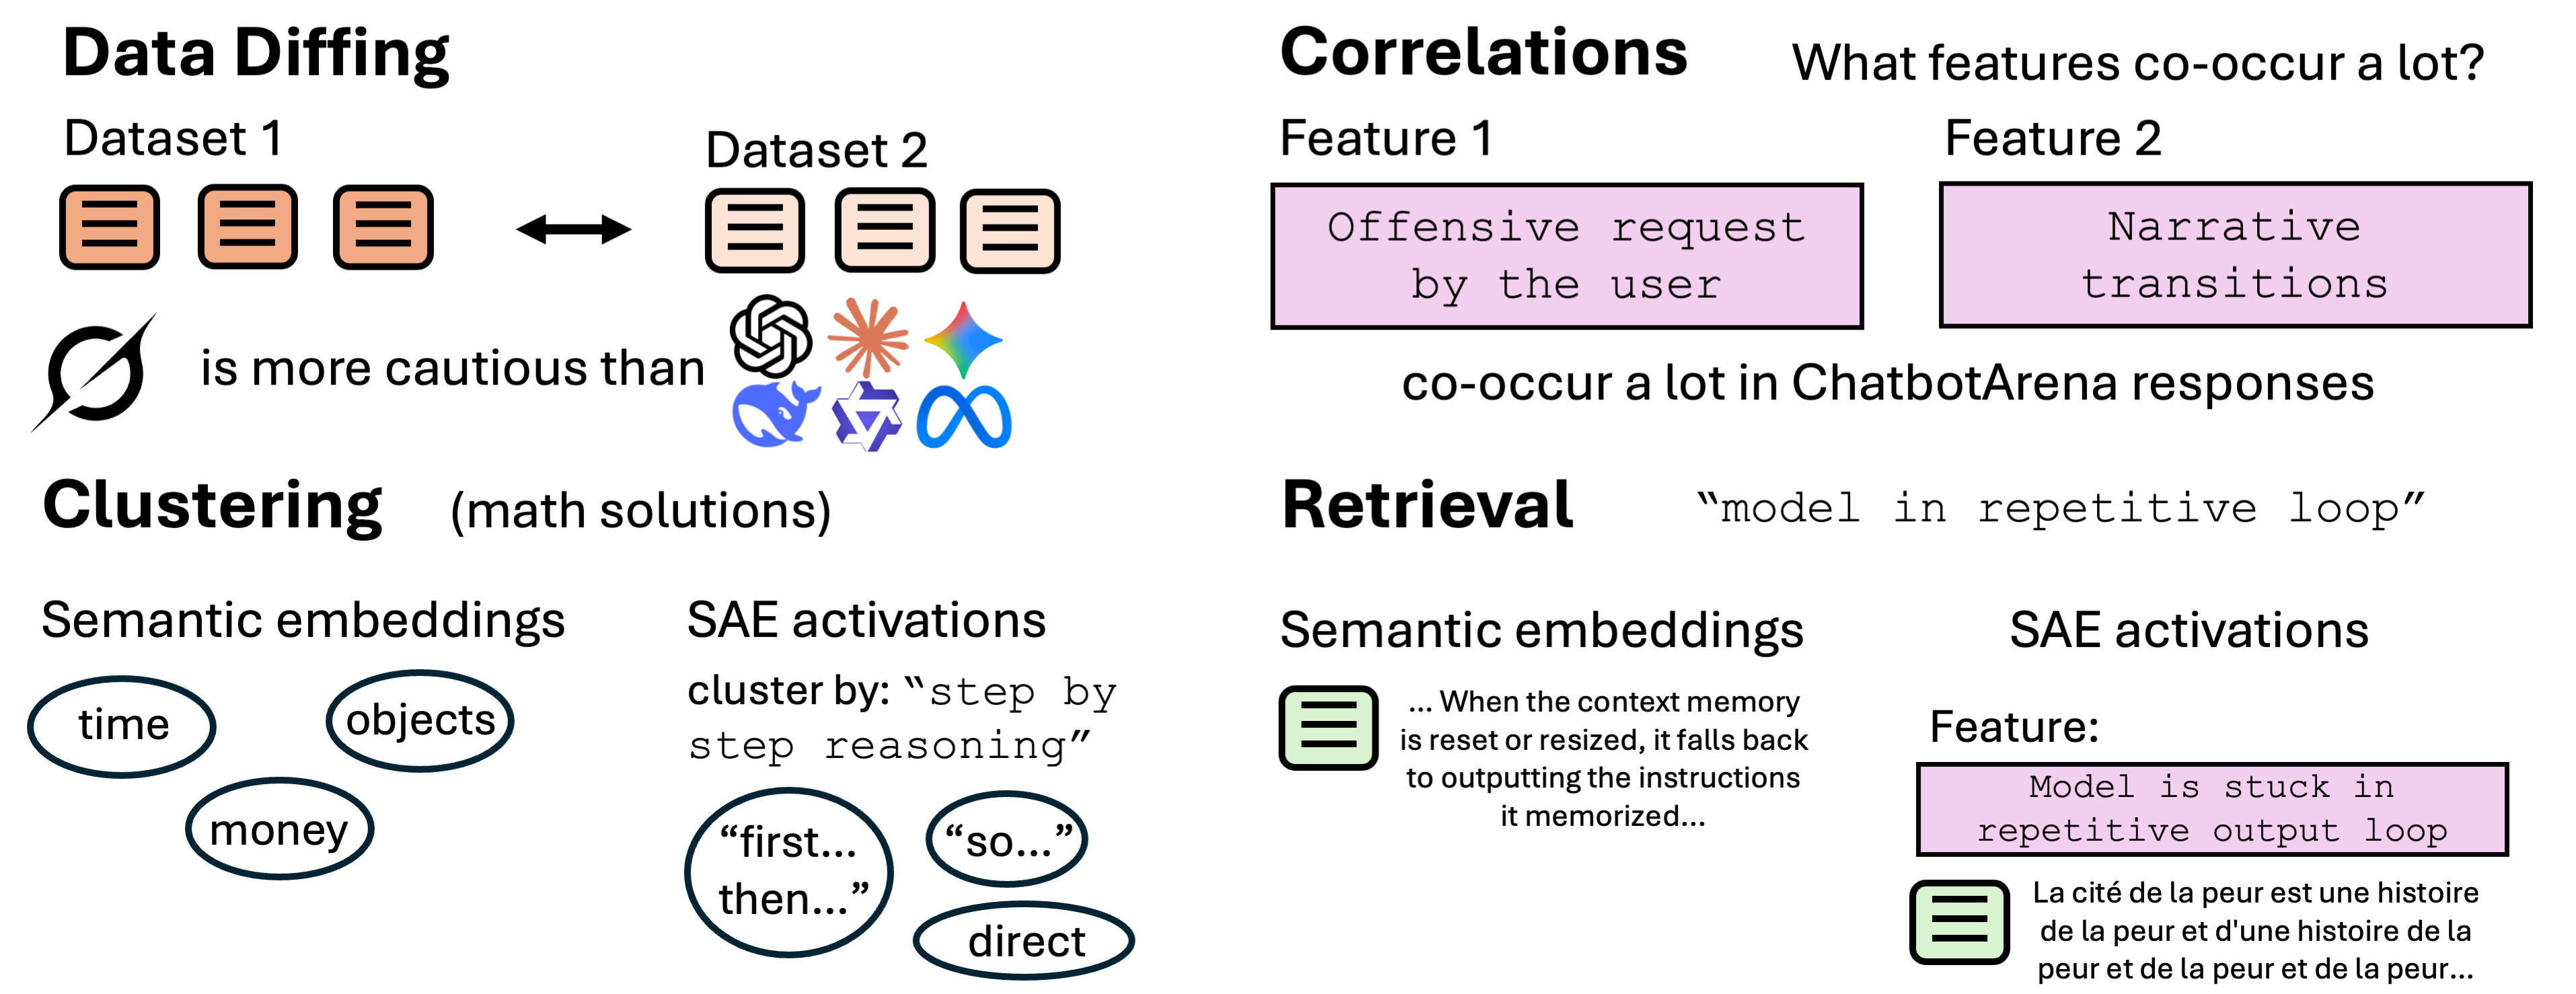
  • We use sparse autoencoders (SAEs) for four textual data analysis
    tasks—data diffing, finding correlations, targeted clustering, and retrieval.
  • We care especially about gaining insights from language model data, such as LLM outputs and training data, as we believe it is an underexplored route for model understanding.
  • For instance, we find that Grok 4 is more careful than other frontier models to state its assumptions and explore nuanced interpretations—showing the kinds of insights data diffing can reveal by comparing model outputs.
  • Why SAEs? Think of features as "tags" of properties for each text.
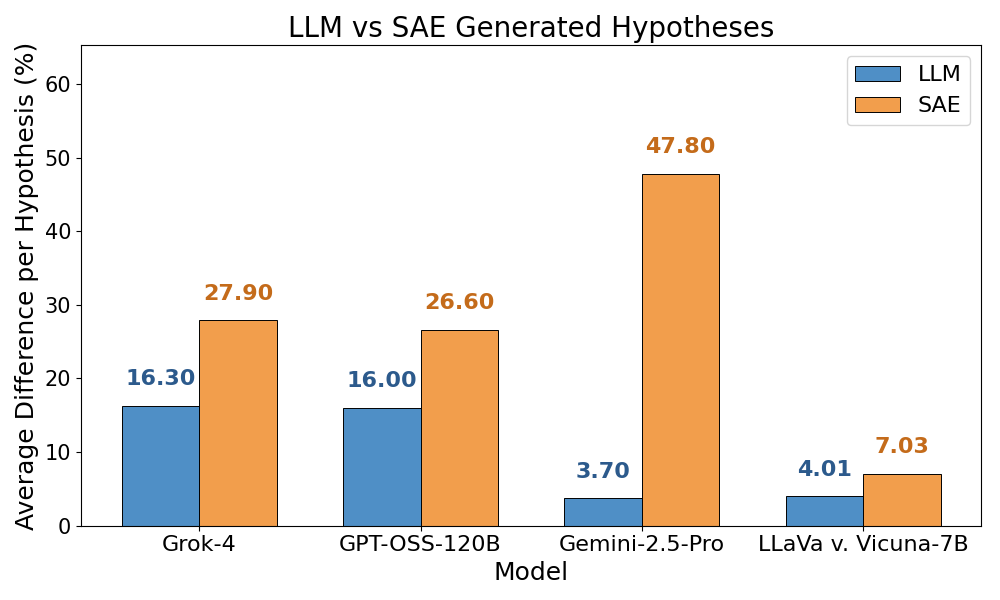
    • Their large dictionary of latents provides a large hypothesis space, enabling the discovery of novel insights (diffing and correlations).
    • SAEs capture more than just semantic information, making them effective alternatives to traditional embeddings when we want to find [...]

---

Outline:

(00:22) TL;DR

(01:48) Introduction

(04:41) Preliminaries

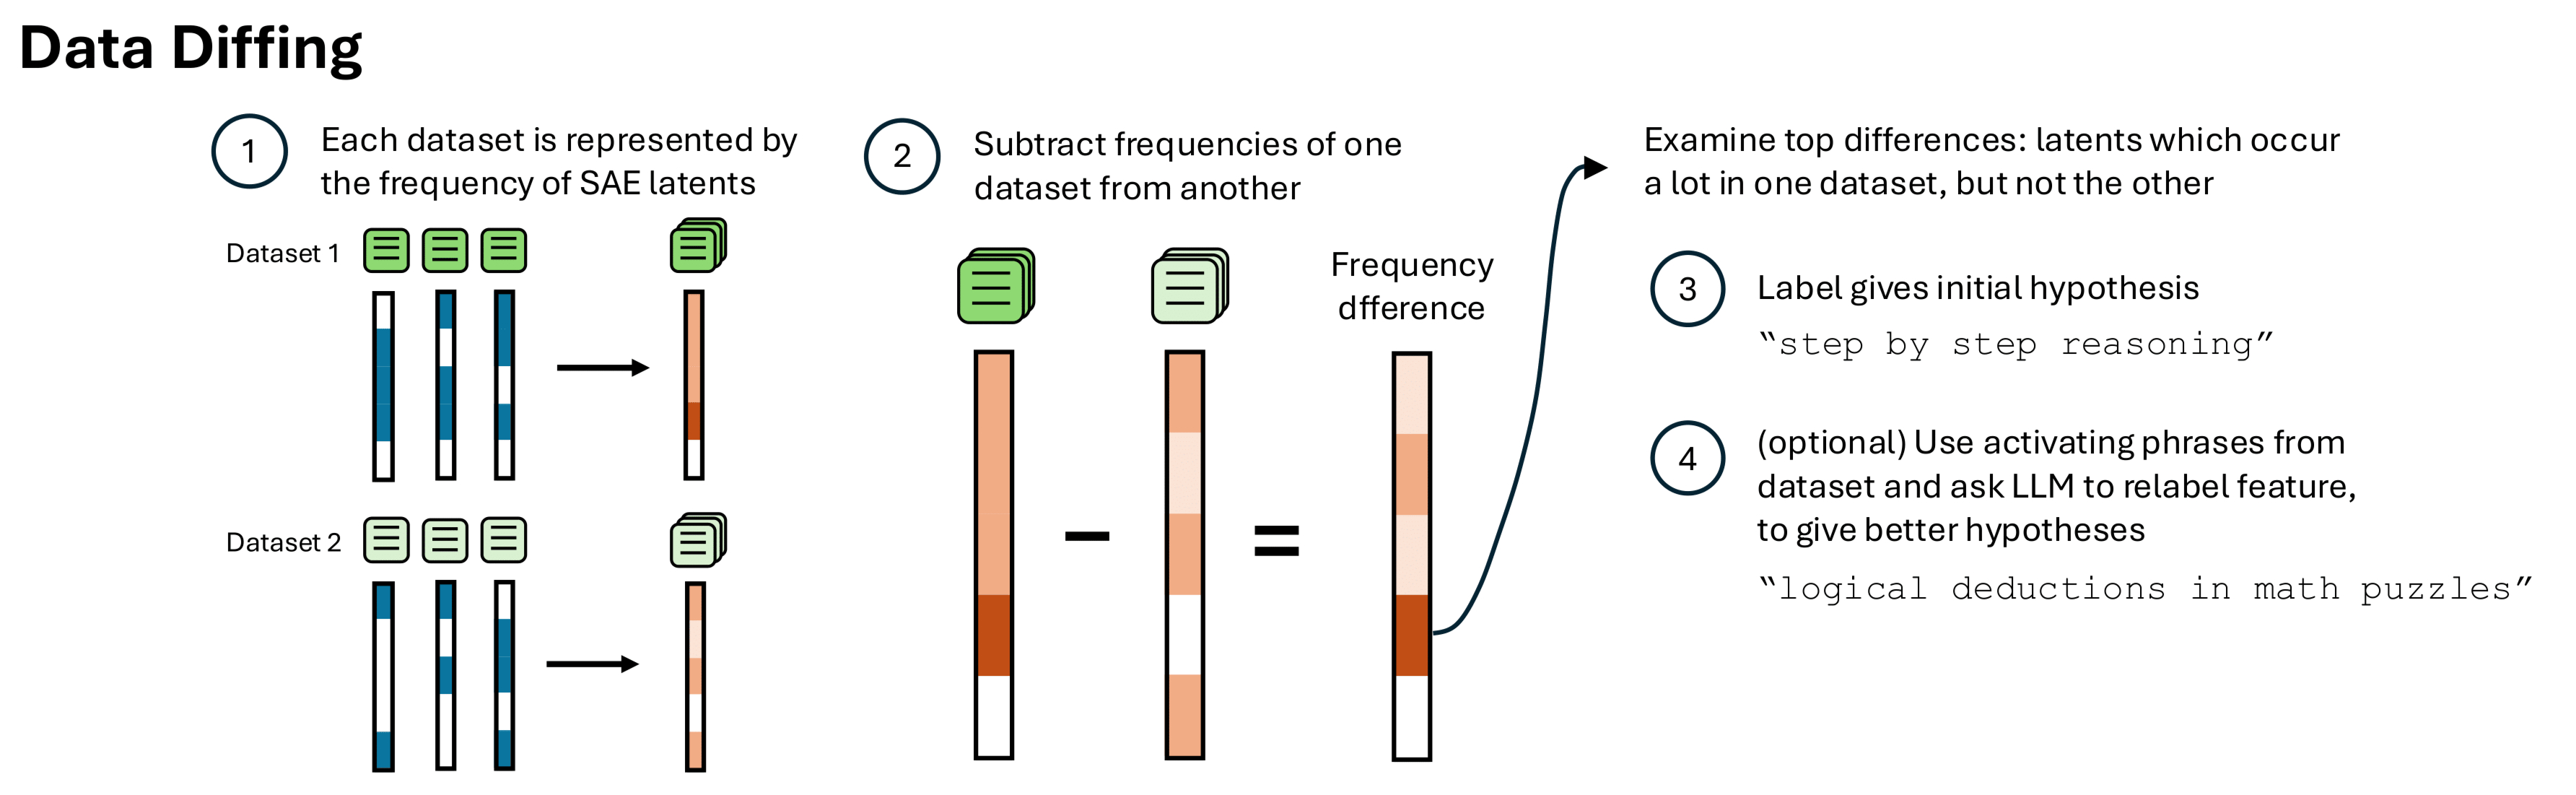
(06:09) Data Diffing

(07:16) Identifying known differences from datasets

(09:09) Discovering novel differences between model behavior

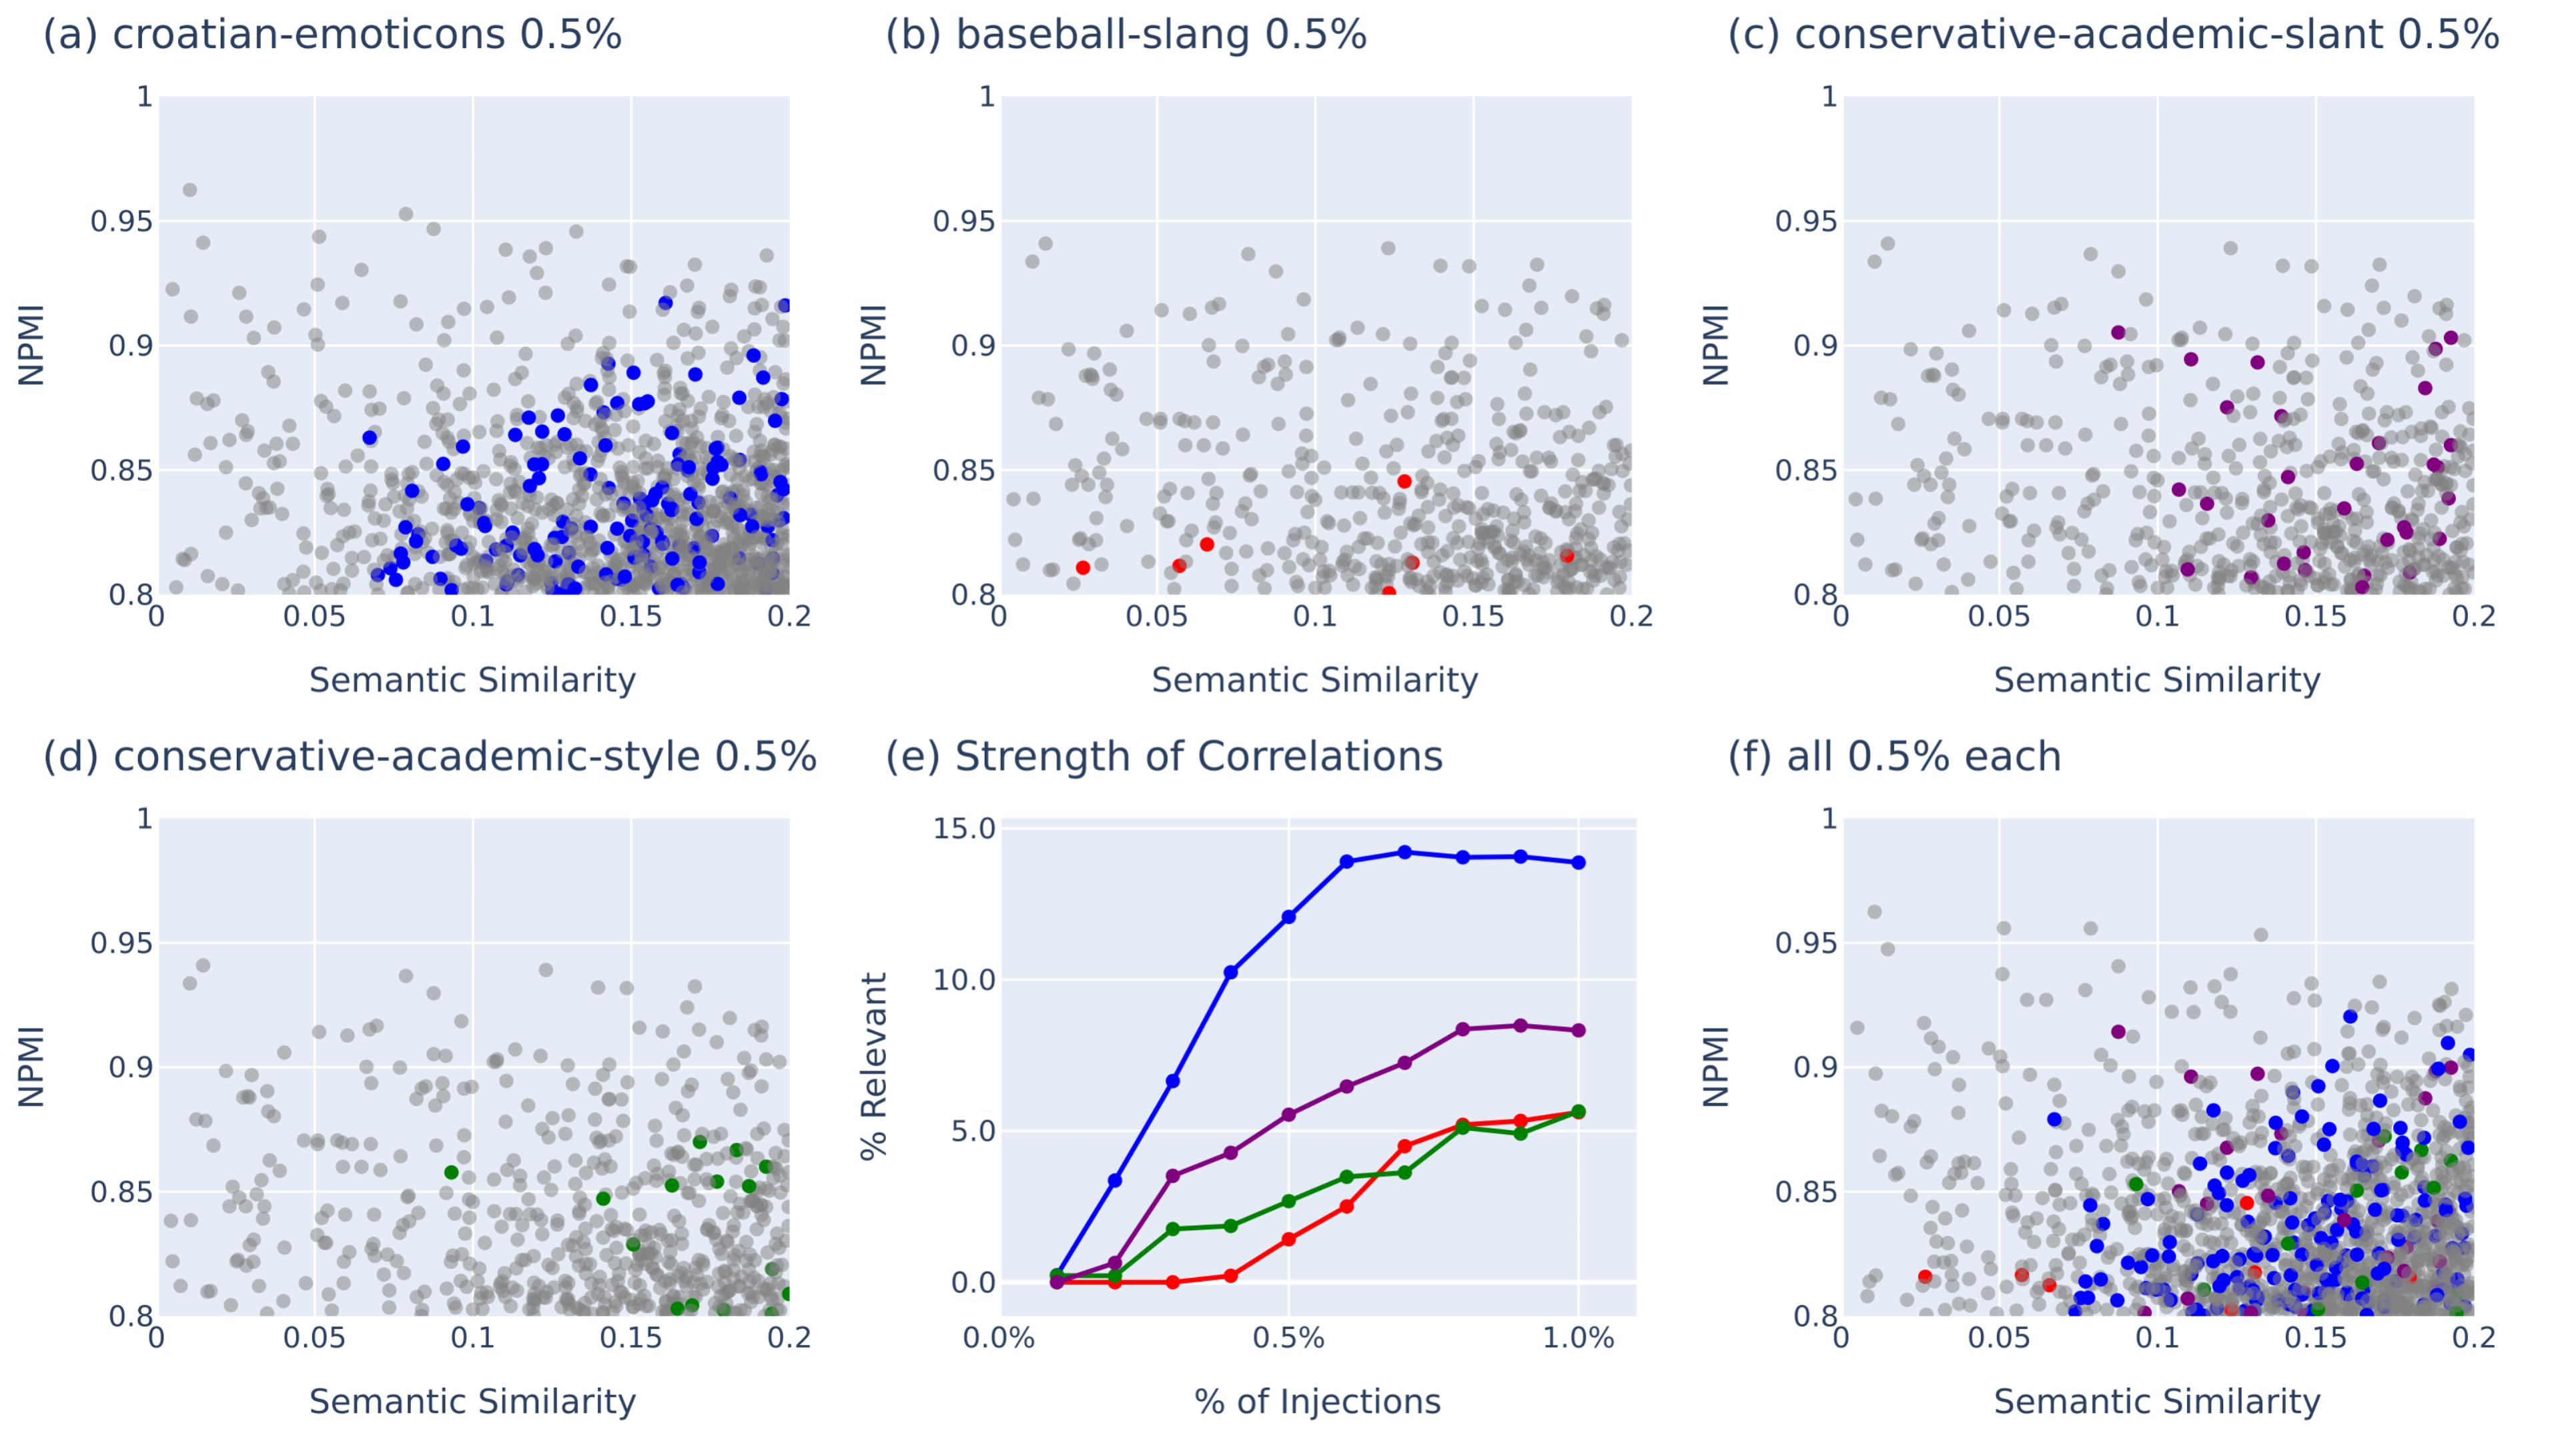
(14:26) Correlations

(16:21) Finding known correlations

(17:45) Finding unknown correlations

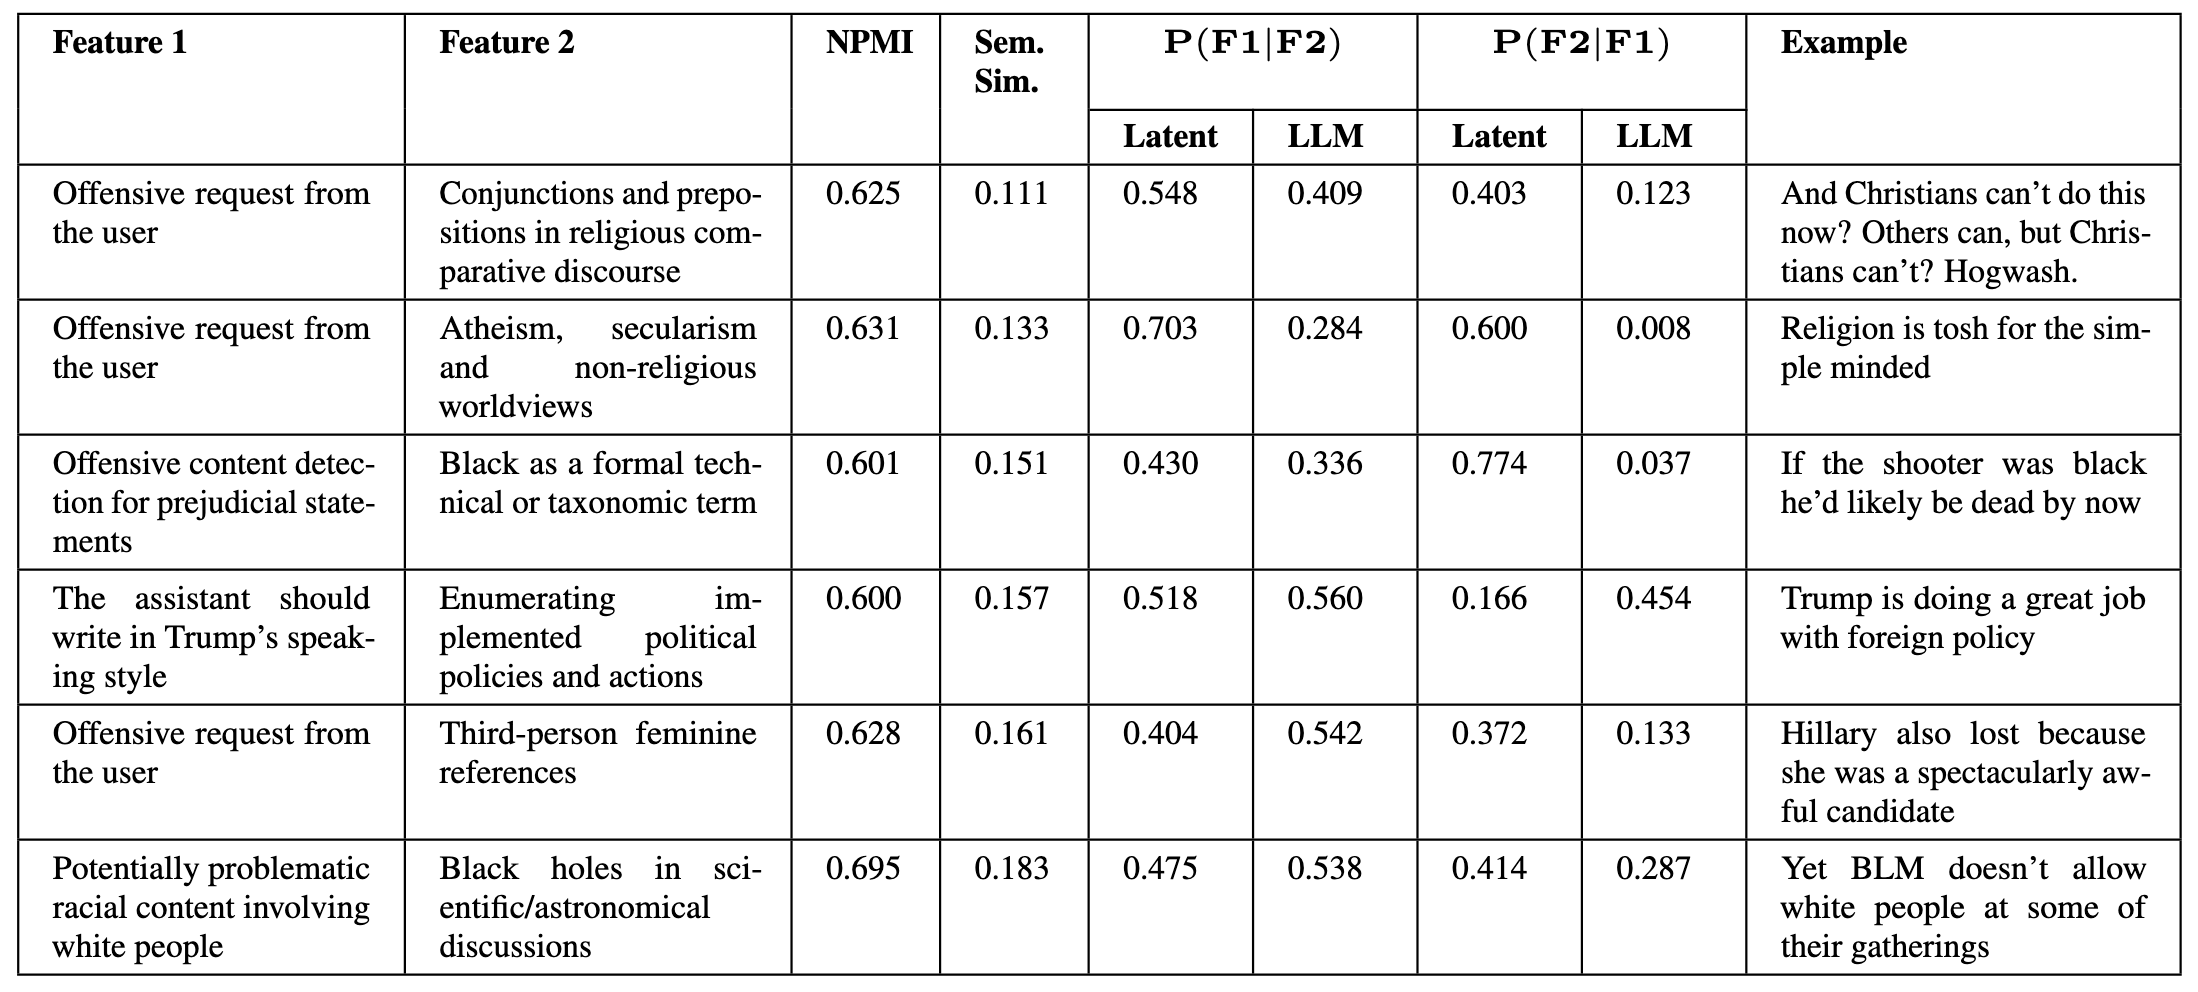
(17:58) Finding bias in internet comments

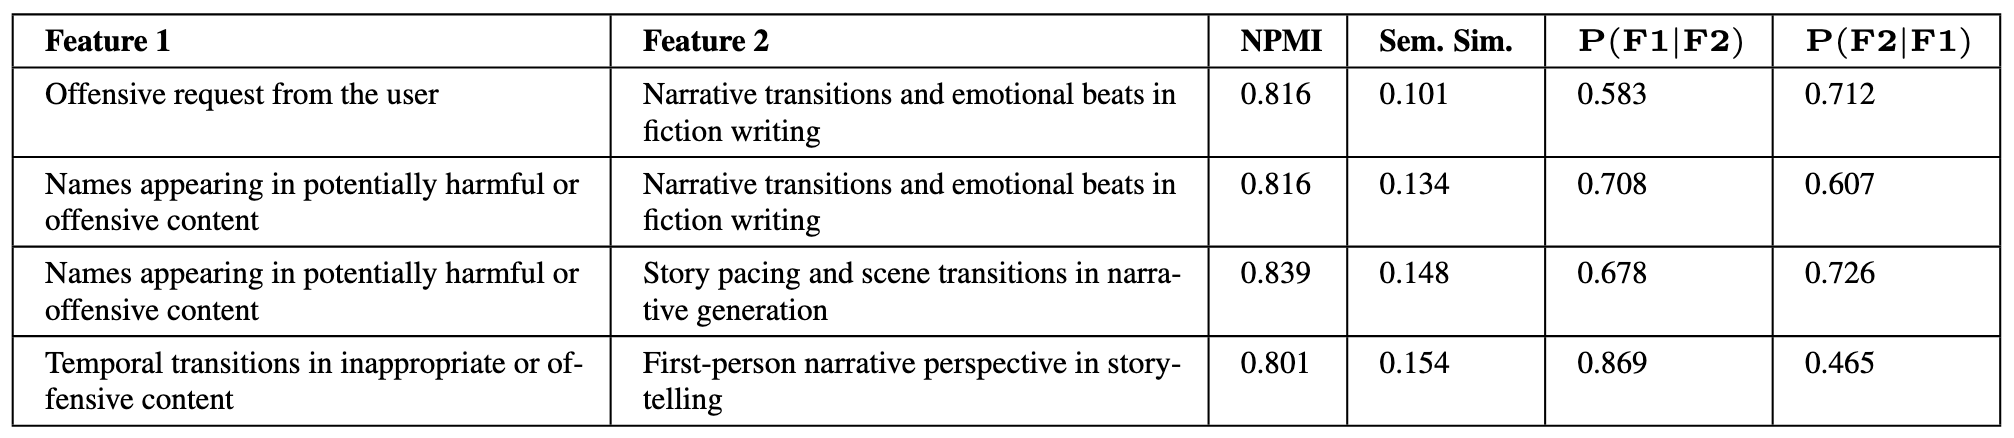
(19:52) Finding patterns in model responses
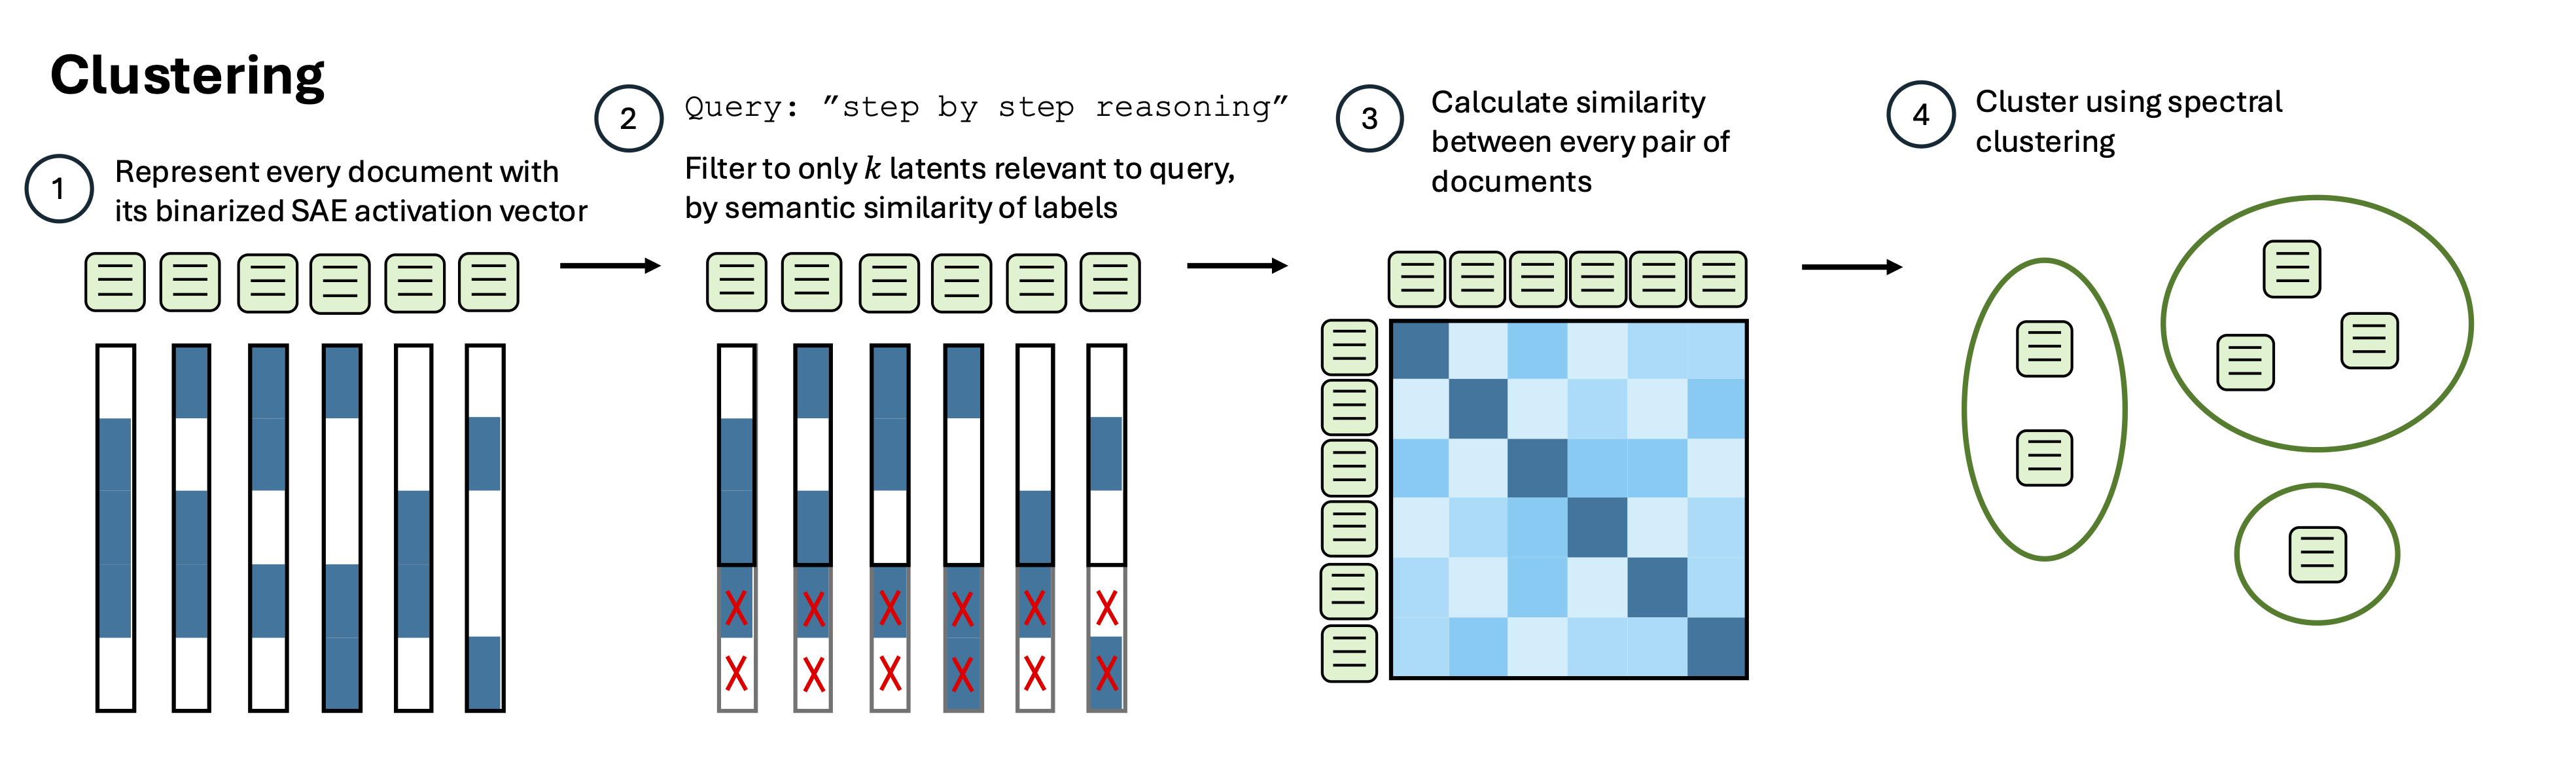
(20:51) Clustering

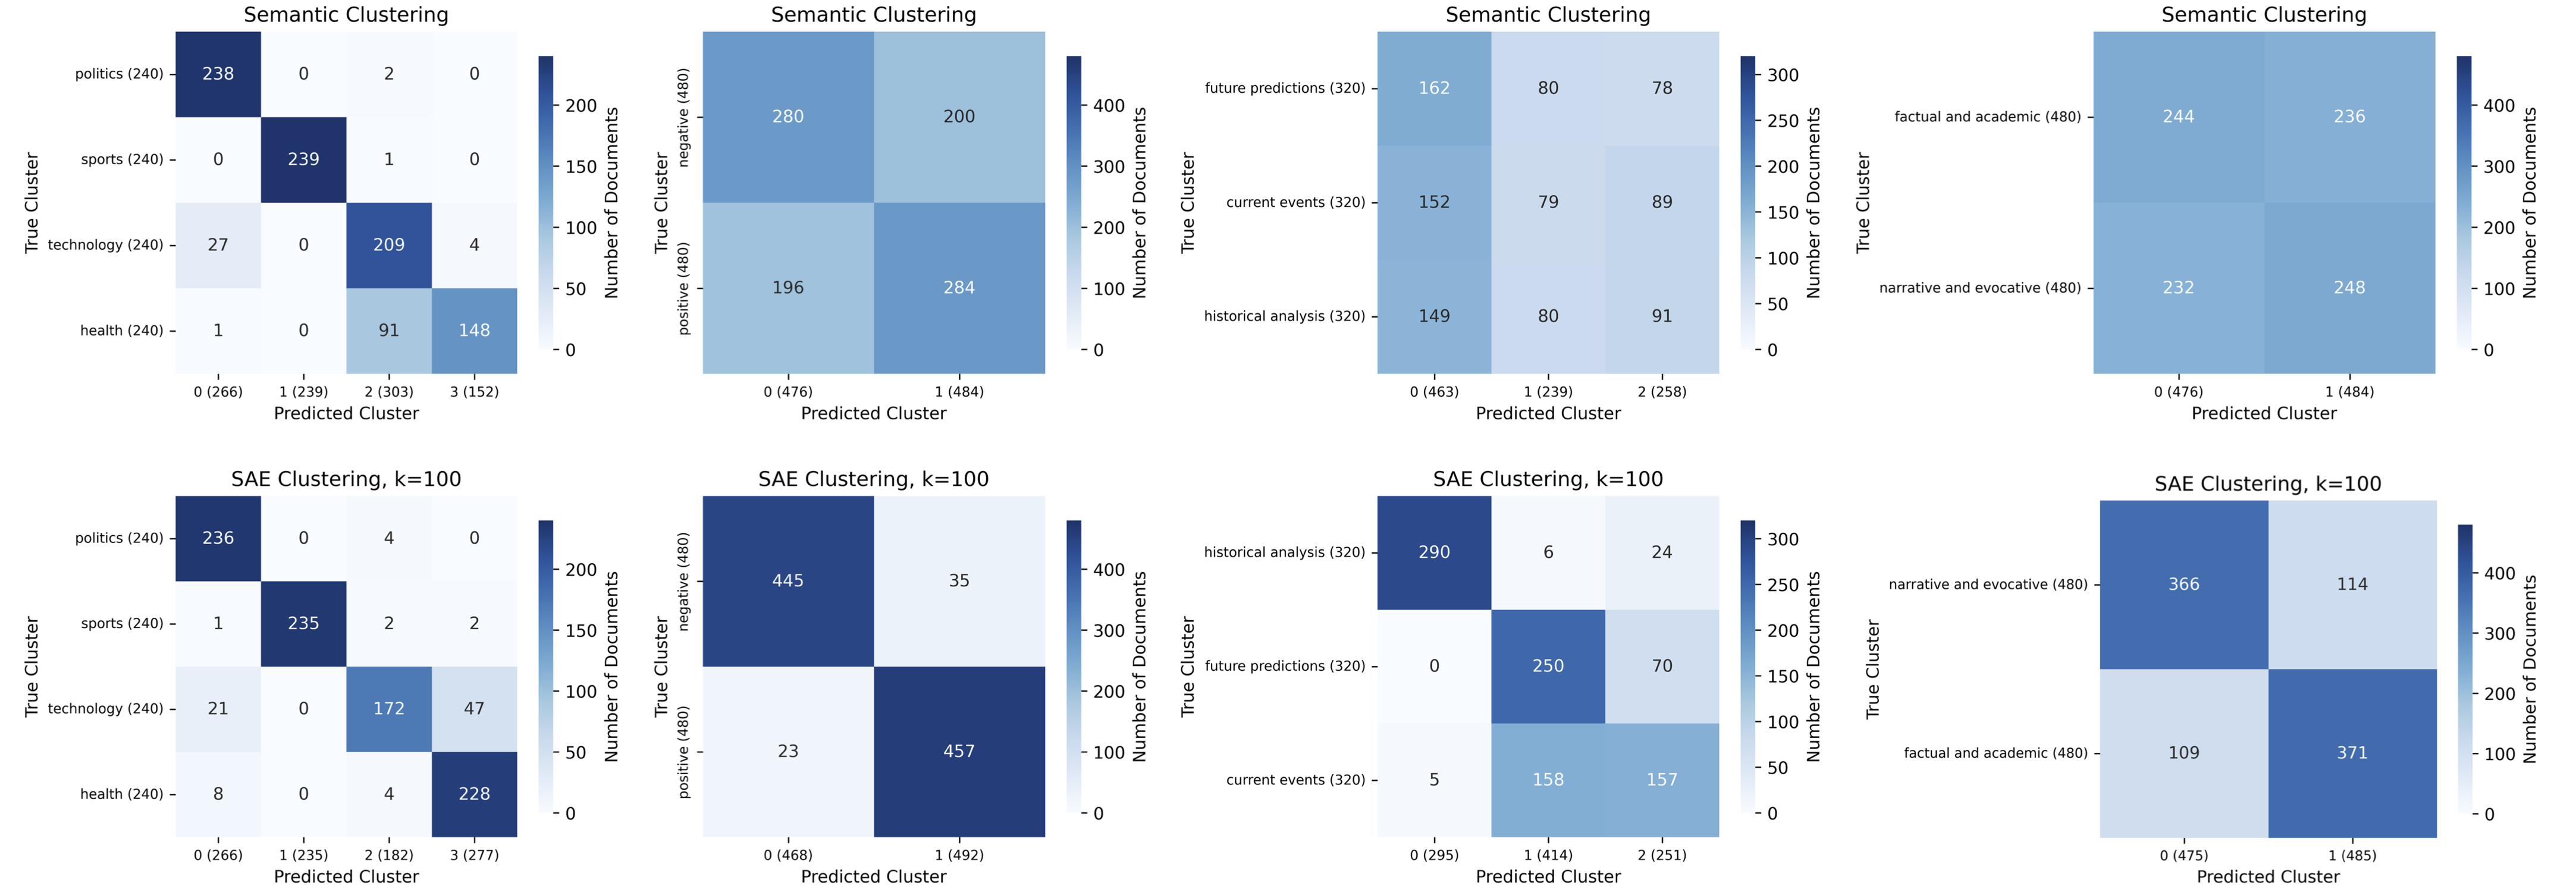
(22:39) Discovering known clusters

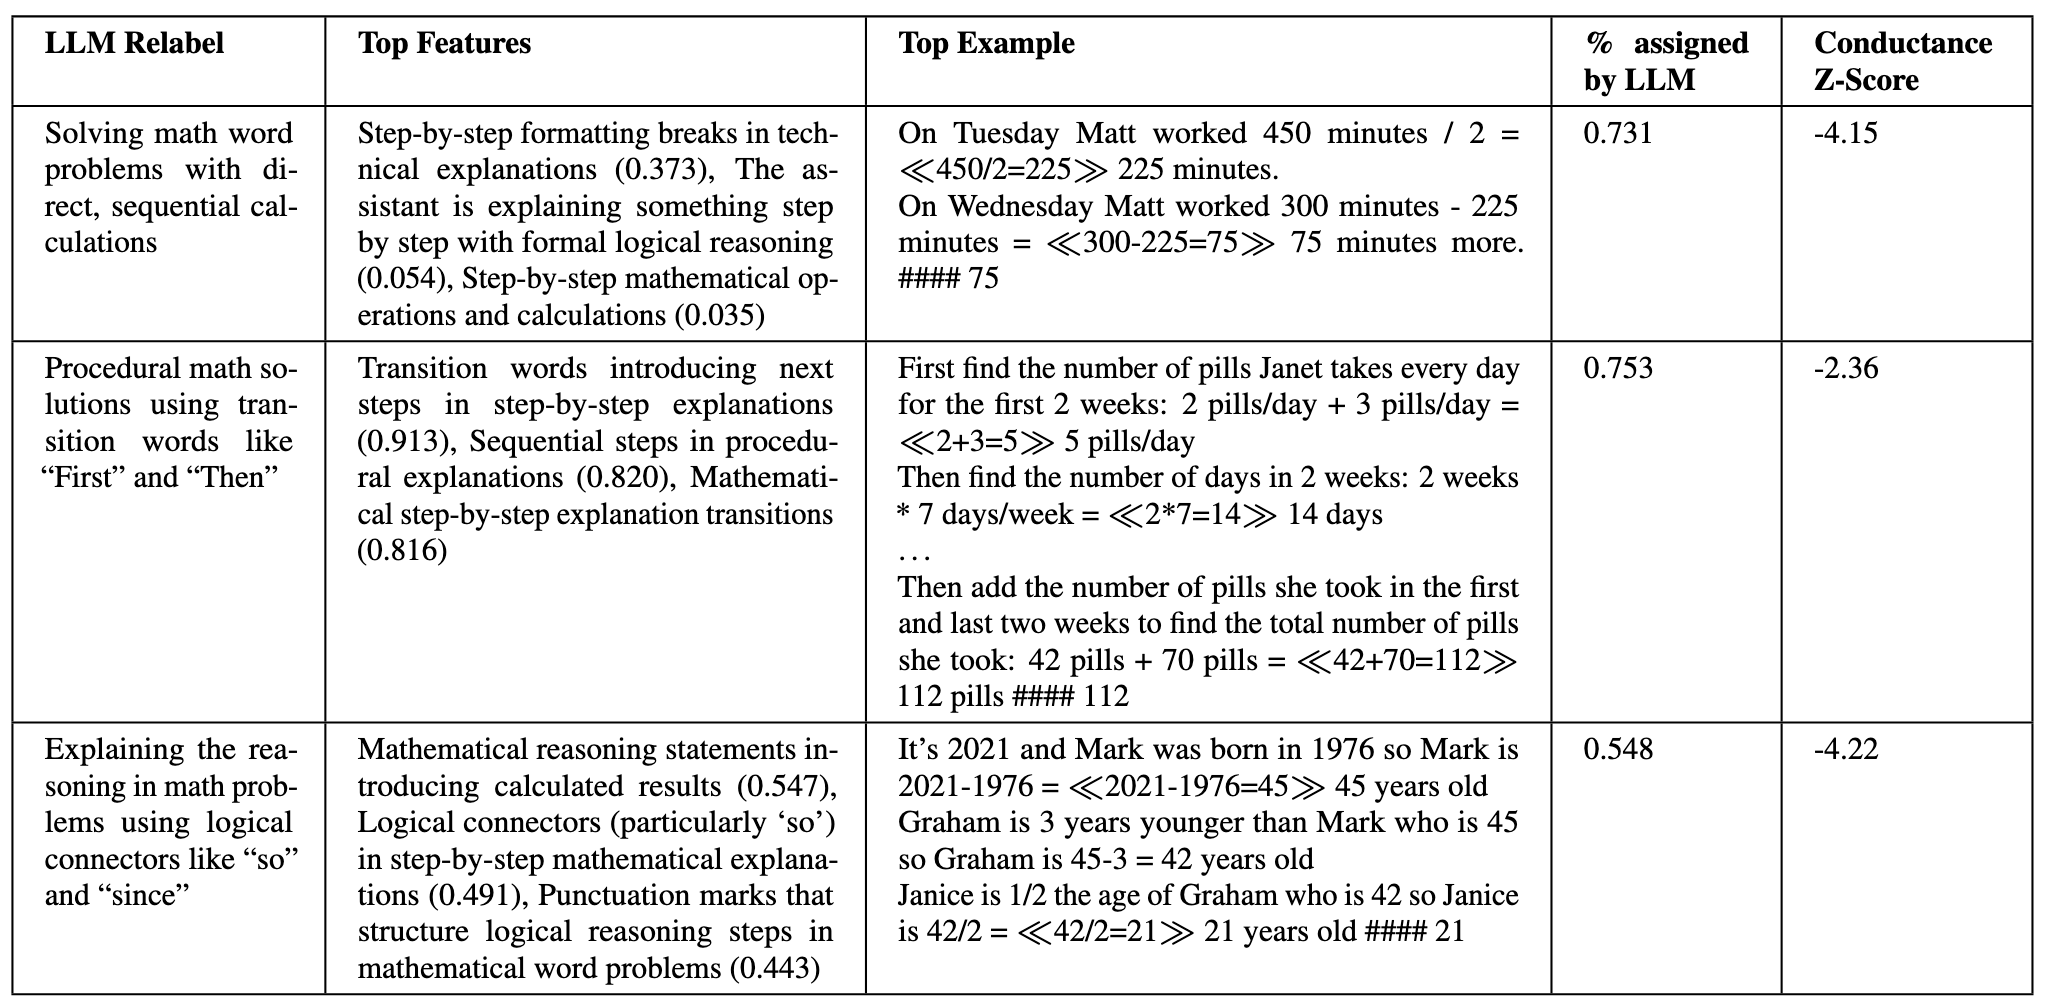
(24:26) Discovering unknown clusters
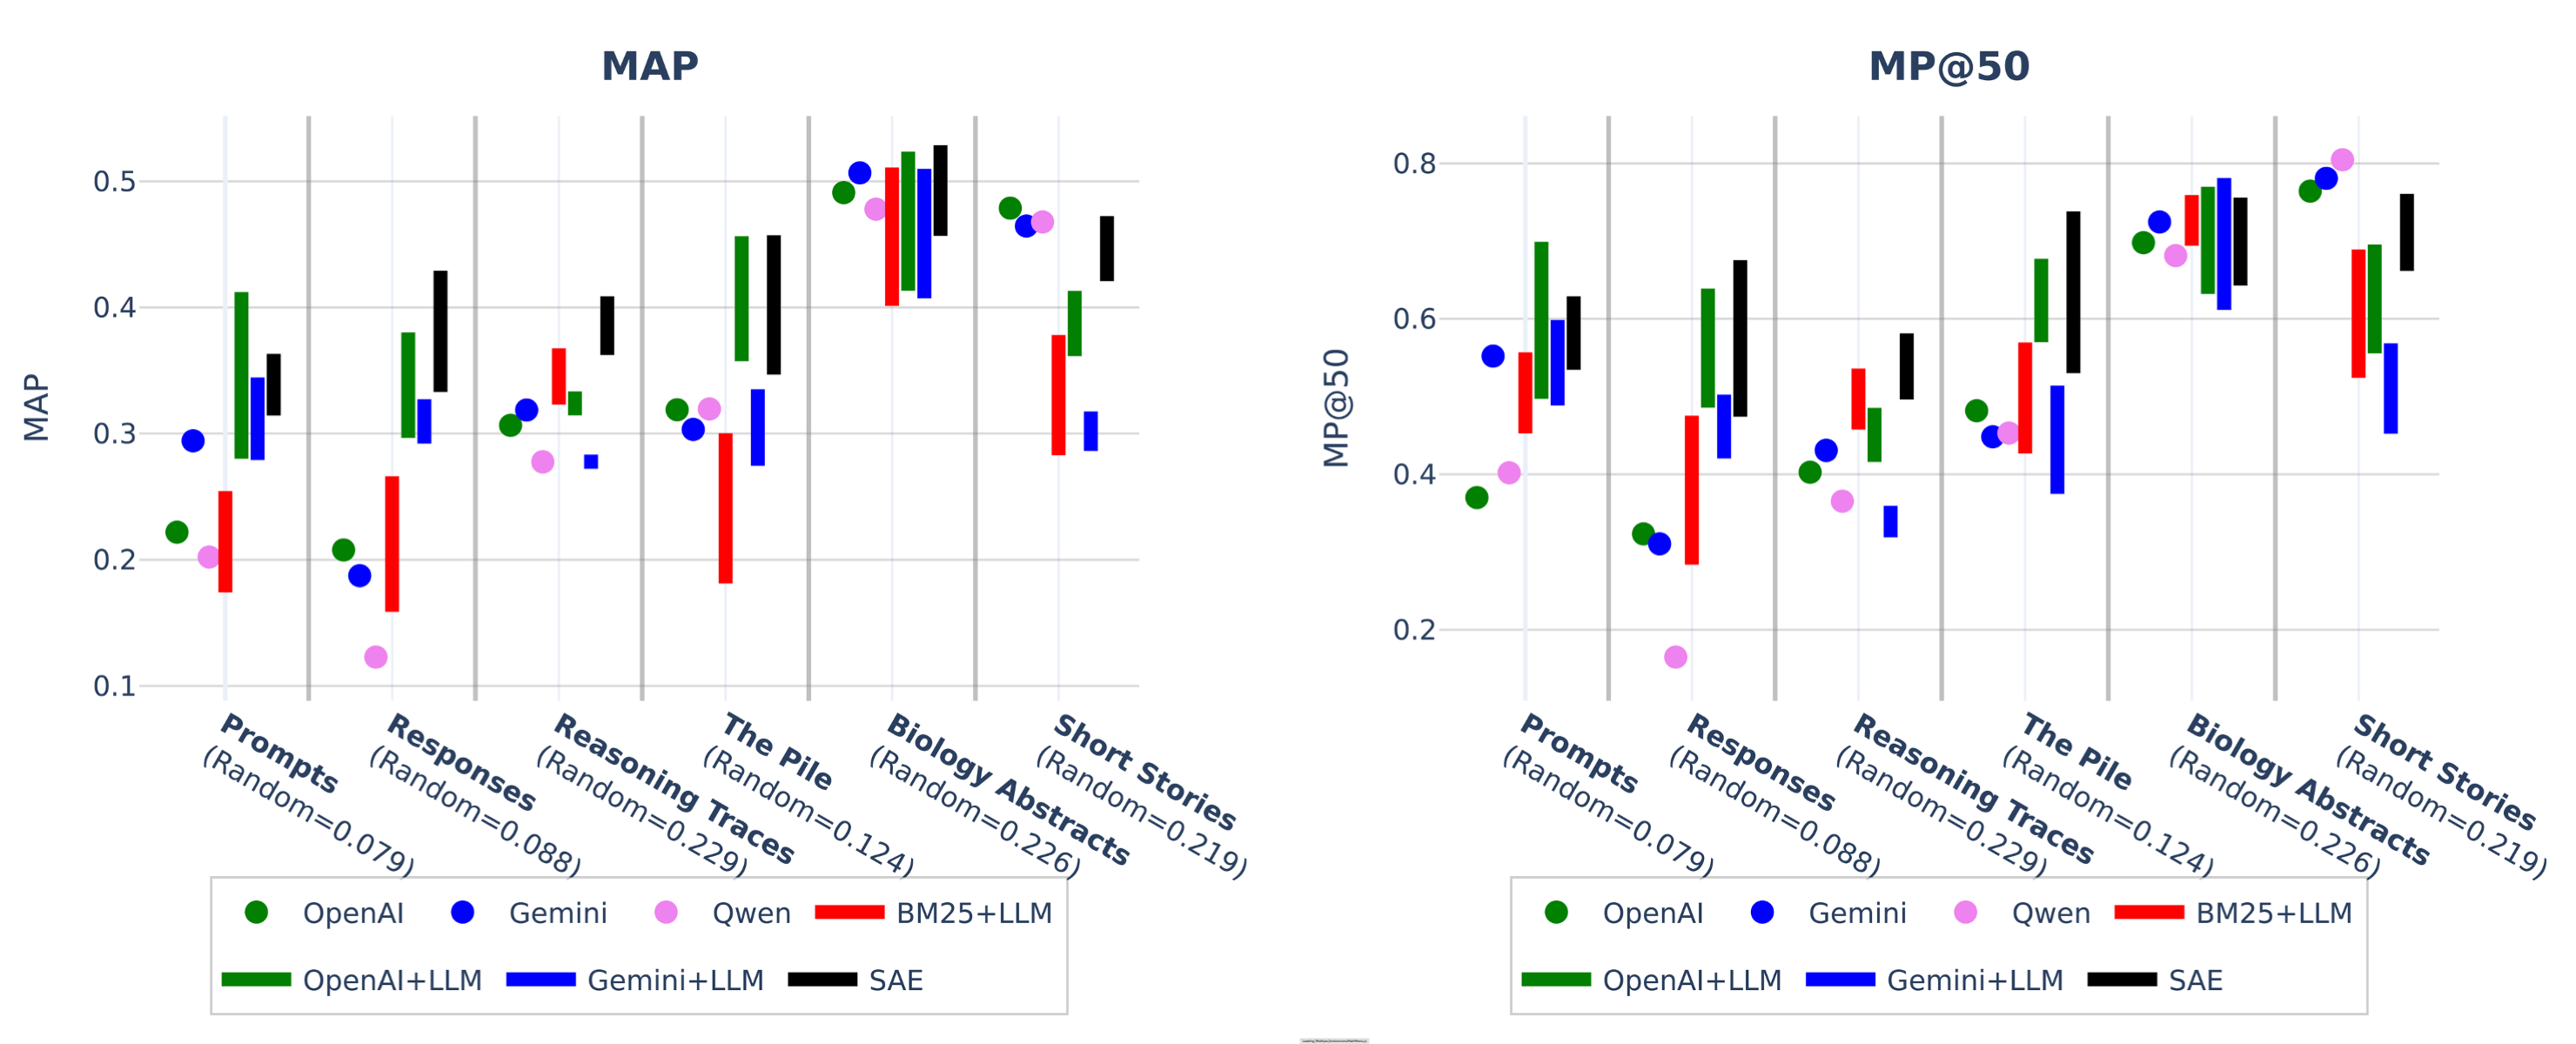
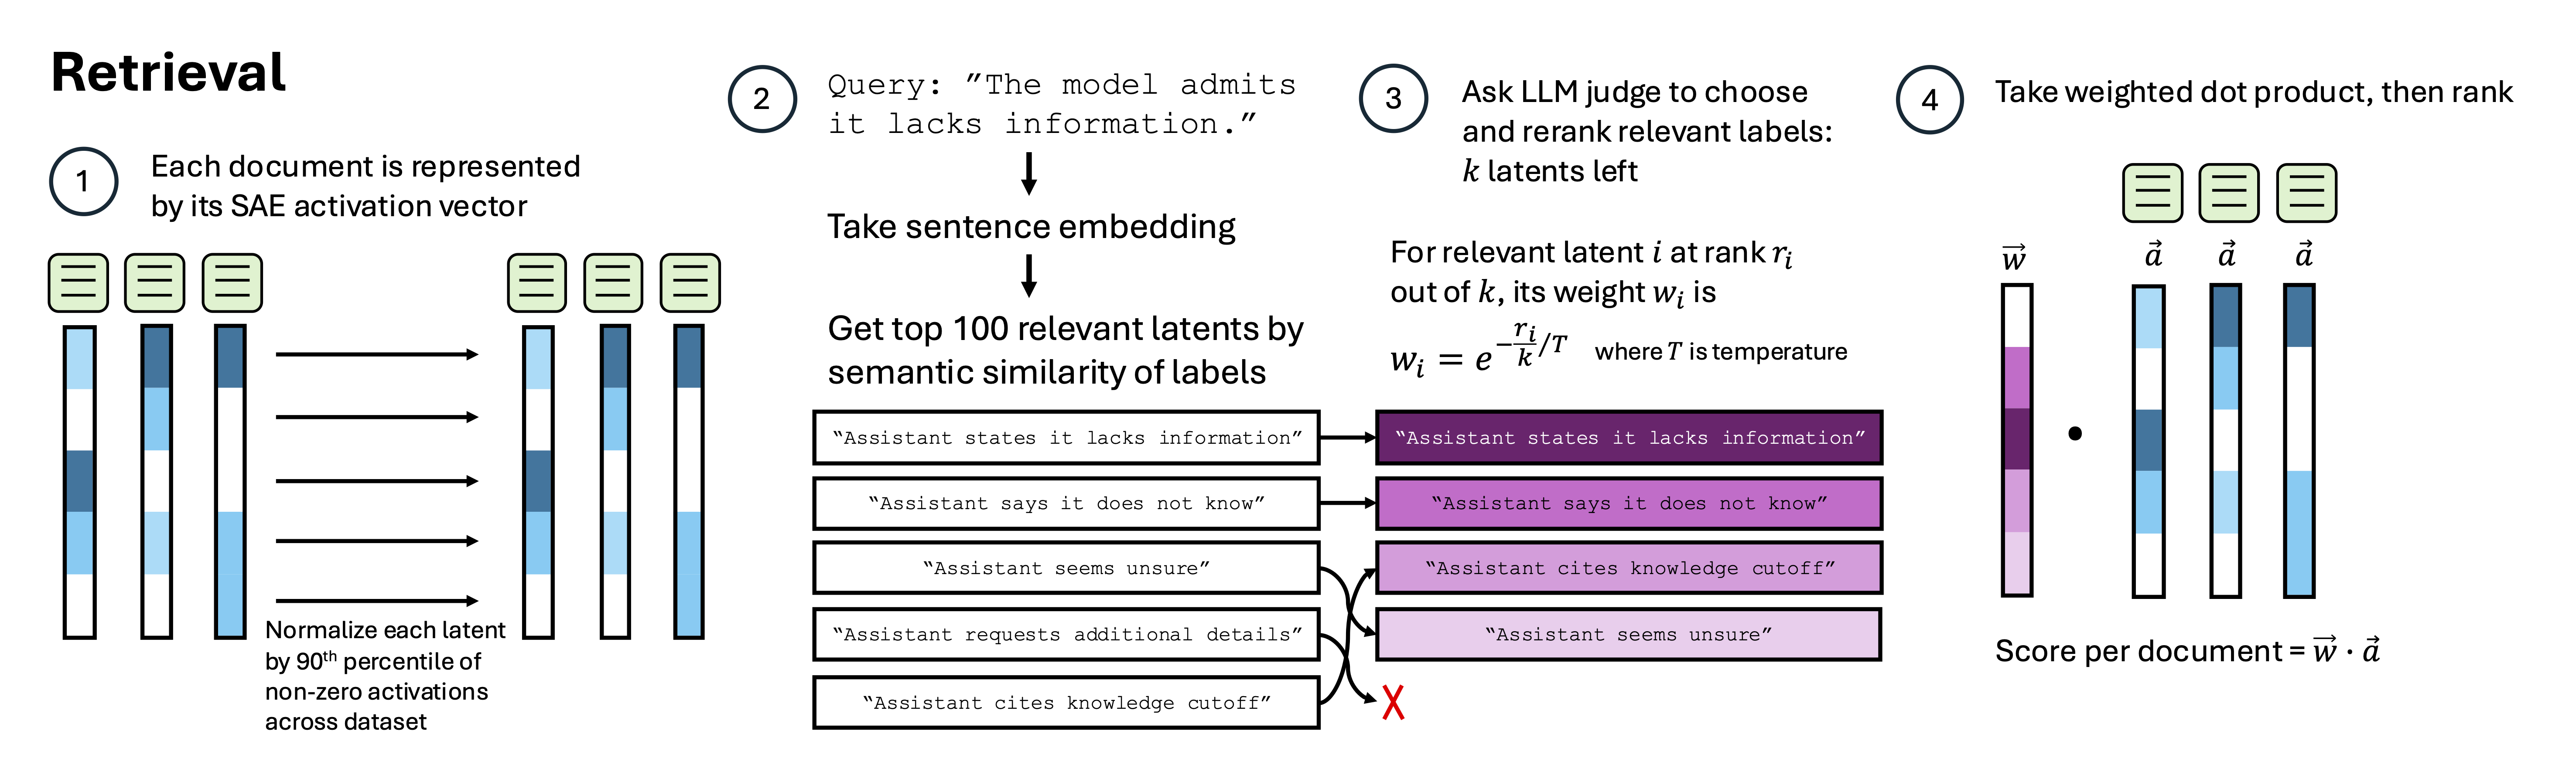
(26:13) Retrieval

(33:45) Discussion and Limitations

(35:06) Awknowledgments

The original text contained 6 footnotes which were omitted from this narration.

---

First published:
August 15th, 2025

Source:
https://www.lesswrong.com/posts/a4EDinzAYtRwpNmx9/towards-data-centric-interpretability-with-sparse

---

Narrated by TYPE III AUDIO.

---

Images from the article:

Methodology for finding differences between datasets
(a)-(d) We plot the candidate group of pairs (NPMI > 0.8, semantic similarity < 0.2), for each type of text injected. Relevant pairs are colored. (e) We show the proportion of relevant pairs in the candidate group for different injection levels. (f) We inject all 3 texts at once and color each correlation.
Examples of “interesting” feature co-occurrences in the CivilComments dataset, among pairs with NPMI > 0.6 and semantic similarity < 0.3. For each pair, we show a phrase from a comment where the features co-occur and the LLM judges both features to be present (selected for illustration purposes).
Examples of “interesting” feature co-occurrences in ChatbotArena model responses, among pairs with NPMI > 0.8 and semantic similarity < 0.3.
Methodology for clustering on SAE activation vectors. We use Jaccard similarity.
Semantic and SAE clustering results: (1) topic (2) sentiment (3) temporal framing and (4) writing style. Mappings from clusters to true labels are found with the Hungarian algorithm.
Table 6: SAE Clustering, using the top 500 features related to “step by step reasoning”. The LLM relabel of each cluster is obtained using the top 5 promoted features and examples (Appendix C.3).
We show the MAP and MP@50, averaged over queries, for each method and dataset. Queryexpansion is done using between 1 and 20 phrases, temperature is varied between 0.01 and 1.5, and the full range is reported here.
For the OpenAI+LLM and SAE methods, we fix the hyperparameters to be their best valuesaveraged across datasets (nphrases = 18 and T = 0.2), and report their individual and combined performance per dataset. We also add in LLM reranking of the top 50.
Performance of SAE method at different T used to aggregate features, for each dataset.
Flow diagram showing correlation analysis between latent vectors and semantic similarity.
Diagram showing feature extraction and max pooling across multiple documents.
Technical diagram showing data analysis concepts: diffing, clustering, correlations, and retrieval.
Technical diagram showing retrieval process for semantic similarity and document ranking.

The image illustrates a 4-step process for document retrieval using SAE activation vectors, query embedding, latent label ranking, and weighted scoring calculations.
Bar graph comparing

Apple Podcasts and Spotify do not show images in the episode description. Try Pocket Casts, or another podcast app.

Senaste avsnitt

Podcastbild

00:00 -00:00
00:00 -00:00